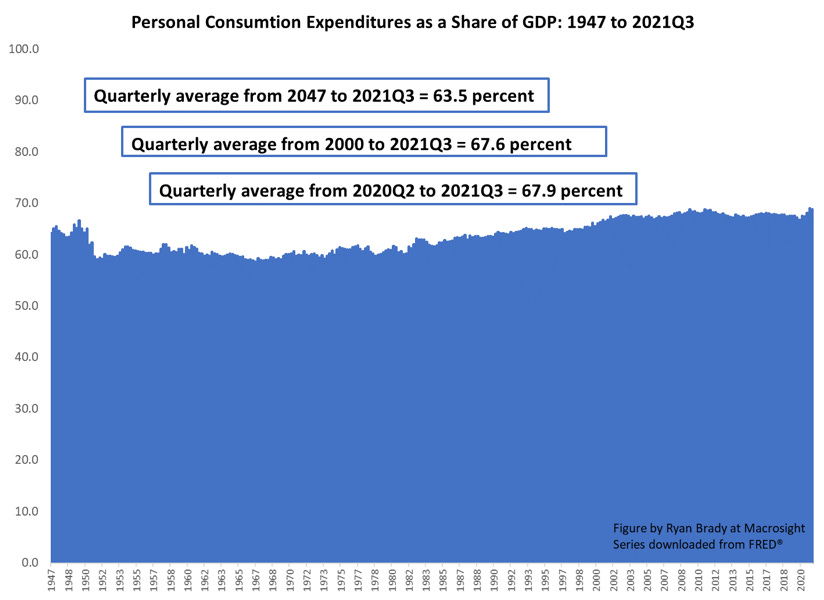
When I teach macroeconomics, I tell my students the following: the American Consumer is a hungry beast—a ravenous, nearly unyielding, beast. I emphasize this because it is my impression that most of them are not aware of how dominant consumer spending is, with respect to the U.S. economy. When I ask them what percentage of our economy is devoted to consumer spending they invariably guess too low—20 percent, or 50 percent, and so on. I suspect, too, if I polled most adults out there—themselves part of the Hungry Beast—they would guess too low also. In fact, when the Bureau of Economic Analysis tallies up our economy, manifesting in our GDP number, consumer spending on goods and services is about two-thirds of the total pie. And it’s been that way, more or less, for a long, long time.
For example, since 1947 (the year official GDP statistics begin, all downloadable via FRED), consumption expenditure as a share of GDP has averaged 63.5 percent of GDP. And, as you can see in the figure below, since 2000, the share is a little higher at 67.6 percent. Since the onset of the Covid-19 pandemic (the second quarter of 2020), the share is 67.9 percent.
In other words, two-thirds of our economic way of life is devoted to satisfying our needs, wants and desires. Arguably, too, the figure above understates it since the investment component of GDP is for the purpose of creating future consumption for the Hungry Beast (“investment,” which includes purchases of equipment, machinery, etc., is about 18 percent of GDP).
So, what does this have to do with inflation in 2021 and going into 2022? Well, check out the behavior of consumer spending since 2003:
From 2003 to the end of 2019, the average monthly growth rate for real consumer spending (percent change from a year ago, 2012 constant prices) was 2.2 percent. That included the Great Recession, but also the longest expansion in history (2009 to 2019) and some strong years in the early 2000s (note, this monthly real series goes back to 2003; one could download the nominal monthly series back to 1959 and then manually deflate with a deflator series, or the CPI, but I decided to be lazy and go with what was quickly downloadable—and going back to 2003 is sufficient for our purposes).
Then, of course, consumption plummeted during 2020 and into 2021 (shown in purple). But then, consumer spending not only snapped-back, but took off.
Since March of 2021, the Hungry Beast has been pillaging the countryside.
Visually it may seem just a few months—the winter-to-early spring of 2021—are dominating the 10.5 percent growth rate shown in the figure. However, if you ignore the very noticeable spikes in April and May of 2021 (growth rates of 25.4 and 15.1 percent, respectively), consumer spending is still historically anomalous. From June 2021 through November 2021 the Hungry Beast ravaged at a 7.5 percent clip.
So, what does this have to do with inflation? And, what does this have to do with the supply chain issues? In light of the consumption data, it seems improbable to me that current inflation is being driven by supply-chain constraints. If you look at the sub-categories of consumption shown in the figure below, the demand-side pressure is all the more obvious. All three categories—durables, nondurables, and services—are well above their 2003 to 2019 averages. Others have rightly pointed out the unusual growth of durables—especially as this category, in particular, makes the shipping and transportation issues headline news—but the other categories, too, are well above the “norm.”
What is going on here? My thesis is not that supply chain problems are irrelevant. Of course they are relevant to the 2021 macroeconomic story (and 2022, too). Rather, I suspect the noticeable effect of the supply chain is a consequence of the Hungry Beast running amok. If consumption in 2021 had, instead, averaged 2.2 consistent with our “normal” business cycle from 2003 to 2019, the supply chain constraints would not be as binding—certainly not to the extent of affording those constraints “star status” in our macroeconomic narrative.
Admittedly, what I have provided here is a “back of the envelope” sketch of things, or a “thought experiment” to reason through things (note, these are clever terms economists like to throw around to sound, well, clever). Regardless, where this leads me is to the question of the Federal Reserve’s power. Does the Fed have the power to squash inflation in 2022? Yes, the Fed does. Supply-chain problems have nothing to do with the Fed’s ability to restrain aggregate demand. And here we see a dramatic increase in aggregate demand from consumption.
To put it more bluntly: if we see inflation continue to surge in 2022 it will be the Fed’s fault. Jerome Powell and company simply need to have the guts to reign in the Hungry Beast.


I think you and I talked about this back in 2020….the idea that many times the paradox of thrift can cause a downturn….but that was not the case in 2020 it wasn’t that people didn’t want to spend money it was that they couldn’t spend money. The question remained what would happen when that pent up demand got released. I guess we are witnessing that first hand
Fascinating charts. Curious how much of the outliers in 2021 (and 2020) are driven by base year effects in the calculation. Do you get a similar story if you compare monthly changes in 2021 to the values in 2019?