The Gold Myth
The last port in the inflation storm?
With the price of gold reaching around $4,000 per ounce, everyone is excited about the precious metal. The conventional wisdom on the price increase is that when times are volatile and prices are rising, investors flock to gold as a “hedge” against inflation. That implies that the value of gold as an asset in your portfolio provides some sort of protection against broader economic volatility and changes in consumer prices. As the rate of inflation accelerates (or is expected to), investors pour their money into gold. As economic tumult persists, gold is like a port in a storm.
The inflation-hedging and safety virtues of gold are frequently cited. One challenge with that narrative, however, is that tale is told everywhere but in the data.
Gold vs the CPI
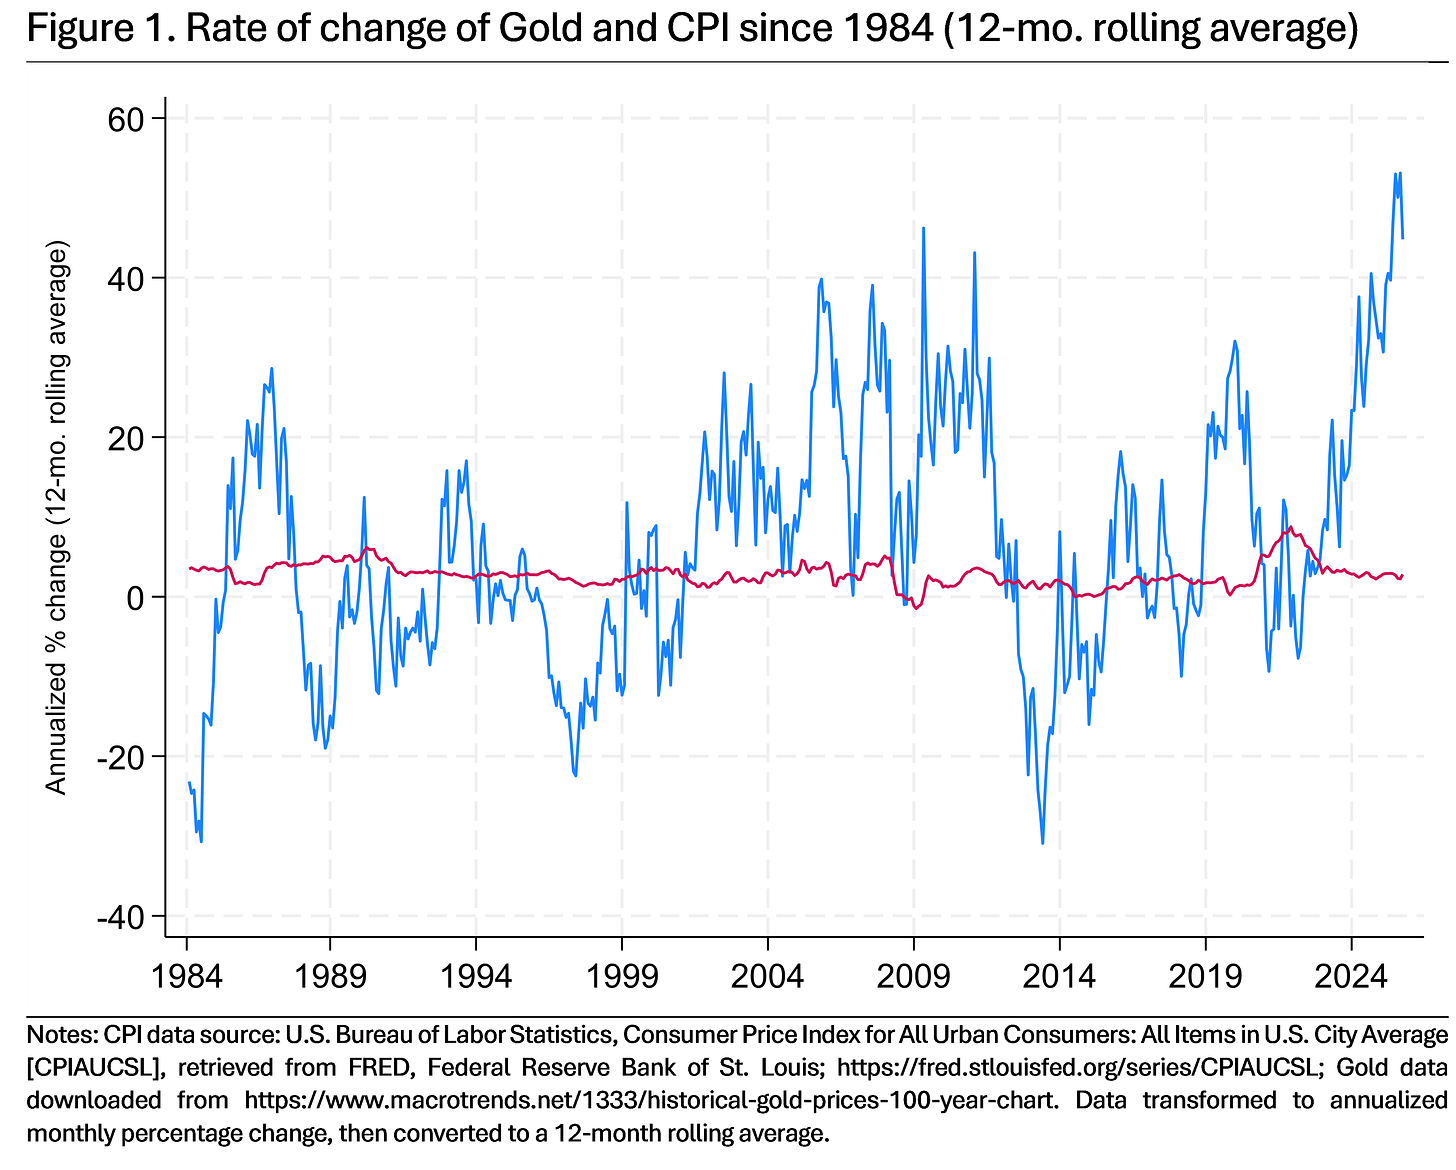
Figure 1 displays the 12-month rolling averages of the CPI rate of inflation (the red line) and the change in the price of gold (the blue line) (each are measured as the annualized monthly percentage change).
The initial take-away from this figure is how volatile the price of gold is relative to the CPI rate of inflation. Indeed, the price of gold is so volatile Macrosight chose to display the 12-month rolling average—as a way to make sense of the patterns in the gold series over time.
Since 1984, the rate of inflation has been relatively calm except for 2021-2023 (the Beastflation period). Since 1984, gold has not been clam. Moreover, there does not appear to be any co-pattern suggesting that the value of gold somehow offsets the rise in inflation. During Beastflation, gold was mostly falling. The past two years inflation has been stable, yet gold has risen to record highs.
For a different perspective, Table 1 shows the correlations between these rolling averages across different eras since 1984.
From 1984 through 2019, there is little correlation between the rate of change of gold and the CPI rate of inflation. The correlation is essentially zero, in fact.
Yet, since 2020, the correlation is notable. A correlation of 0.7 in either direction is considered strong. And a negative correlation of 0.7 implies that as the rate of inflation has increased the price of gold has declined, and vice versa. For gold to be an inflation “hedge” the opposite should be the case. The rise in the price of gold should outpace (or at least keep up with) inflation in a positive direction.
Maybe gold catches up to inflation?
The statistical evidence above emphasizes coincident movements in gold and inflation. Maybe instead the price of gold changes only after inflation has been increasing for a time.
Table 2 shows the correlations of the annualized monthly change in the price of gold with the rate of inflation over different months—the current month and 12 months in the past. In this way, we can see if today’s change in the price of gold is somehow correlated with changes in inflation in prior months (suggesting gold acts belatedly in response to changes in inflation).
Table 2 reveals that even from this perspective the connection between movements in gold prices and is essentially non-existent (these correlations are for the series measured as the annualized monthly rate of change, and not as a 12-month rolling average).1
Yeah, but Gold is Shiny!
Busting the Gold-as-inflation-hedge myth does not imply gold is worthless. Rather, if one wants to buy gold, do so from the perspective of broader portfolio theory. Does it help you diversify risk? Is it negatively correlated with other assets in your portfolio? Etc.
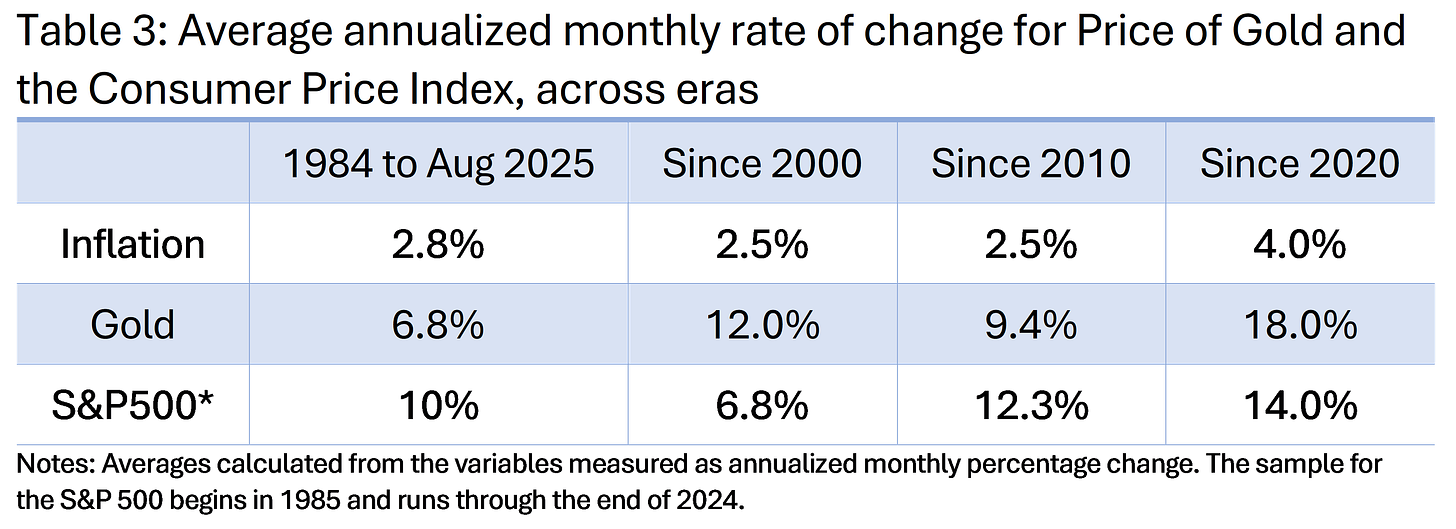
Table 3 displays the average annualized rates of change of gold, the rate of inflation, and the S&P500 since the mid-1980s (across the different eras shown in Table 1).
Both gold and the S&P 500 have out-paced inflation. The latter has done so a little more so since 1984, though that correlation changes depending on the era delineated in Table 3. Since 2020, gold has done better (though most of that has come in the last year or so, as one can see in Figure 1).2
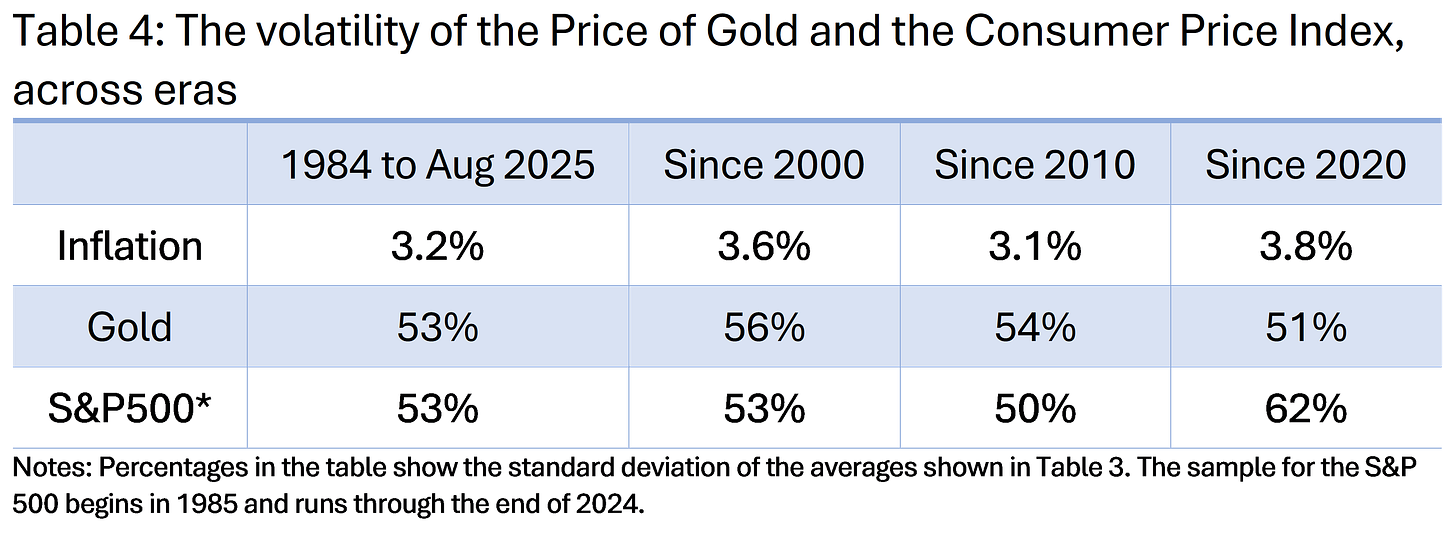
Table 4 displays the volatilities of each of these series (measured as the standard deviation).
Overall, gold has not been much more volatile than the S&P500 the past 40 years (note, if these numbers appear to be heart-attack-inducing that is because they are annualized monthly numbers. Divide by 12 for a simple way of seeing the actual month-to-month volatility. We show everything annualized since that is how the rate of inflation is typically presented and/or discussed). Both gold and the S&P have been waaay more volatile than the rate of inflation.
With respect to diversifying with gold, Table 5 shows the correlation between movements in the price of gold and the S&P 500 (again, at the monthly frequency). For the entirety of the sample there is little correlation between the ups and downs of each asset class. From 1984 through August of 2025, there is a slight negative correlation, which is good for diversification purposes (all else equal), though the magnitude suggests very little off-setting movement. Since 2020, however, the correlation between monthly changes in the S&P and gold have been a little stronger and positive.
In the popular imagination, gold is shrouded in the mysterious power of hedging against inflation. Yet, statistically, there is nothing mysterious about gold. It is no more of a “safe-haven” from inflation than investing in the stock market.
One could also use more sophisticated analysis such as regression analysis or more involved system-of-equations estimation. Macrosight did both and did not find any compelling evidence that over-turned the general conclusion from the correlations.
Given the values in the table, one can easily calculate the real rates of change for these series (or the “inflation-adjusted” rates of change). The real rate of increase for gold for example, from 1984 to 2025, is 4.0% (6.8% - 2.8).


