The prevailing wisdom, it seems, is that it is only a matter of time that a recession will occur.1 In fact, there was a recent article from a well-known news source that reported that their modelers were projecting a 100% chance that a recession will occur by next October. 100%!!!
A forecaster predicting a 100 percent chance of anything is pretty bold. I admire their confidence.
But, 100 percent might be overstating it. What are the chances, then?
As a first pass, we can see what the Fed thinks. As I discussed in detail here, the Fed publishes their forecasts four times a year. Here is a snippet of their forecast from this past September:
The Fed expects the U.S. economy to finish 2022 in the black.2 Since the average quarterly growth rate over the first half of this year was negative 1.1 percent (-1.6 and -0.5 percent in the first and second quarter, respectively), the Fed’s 2022 forecast implies they expect the economy to expand by a positive 1.5 percent over the second half of this year. Given what a macroeconomic headache we’ve been experiencing, the Fed is relatively bullish. That appears to be the case, too, for 2023 and beyond.
The Fed does not see a recession on the horizon. Why not? Are they wide-eyed optimists? Probably not—these are economists generating these forecasts after all. More likely, Jerome Powell et al. are confident in their ability to guide real GDP down from a historic high in 2021 via their current and on-going interest rate increases. They are forecasting a soft-landing, in other words.
Is that realistic? In my experience with forecasting, the Fed’s expectation is as valid as any. The results depend on the model one is using. The outlet I refereed to earlier has a model (or a series of models and simulations), that has converged on certainty. The Fed does not provide probabilities, but they do provide some range of values produced by their various forecasting models.
Typically, most entities out there do not publish or reveal the details of their models. But, there are some core tenets of forecasting that we can use to make our own forecast and, then, conjecture how the Fed or others are coming up with their projections.
My Forecast: Less than 100% chance
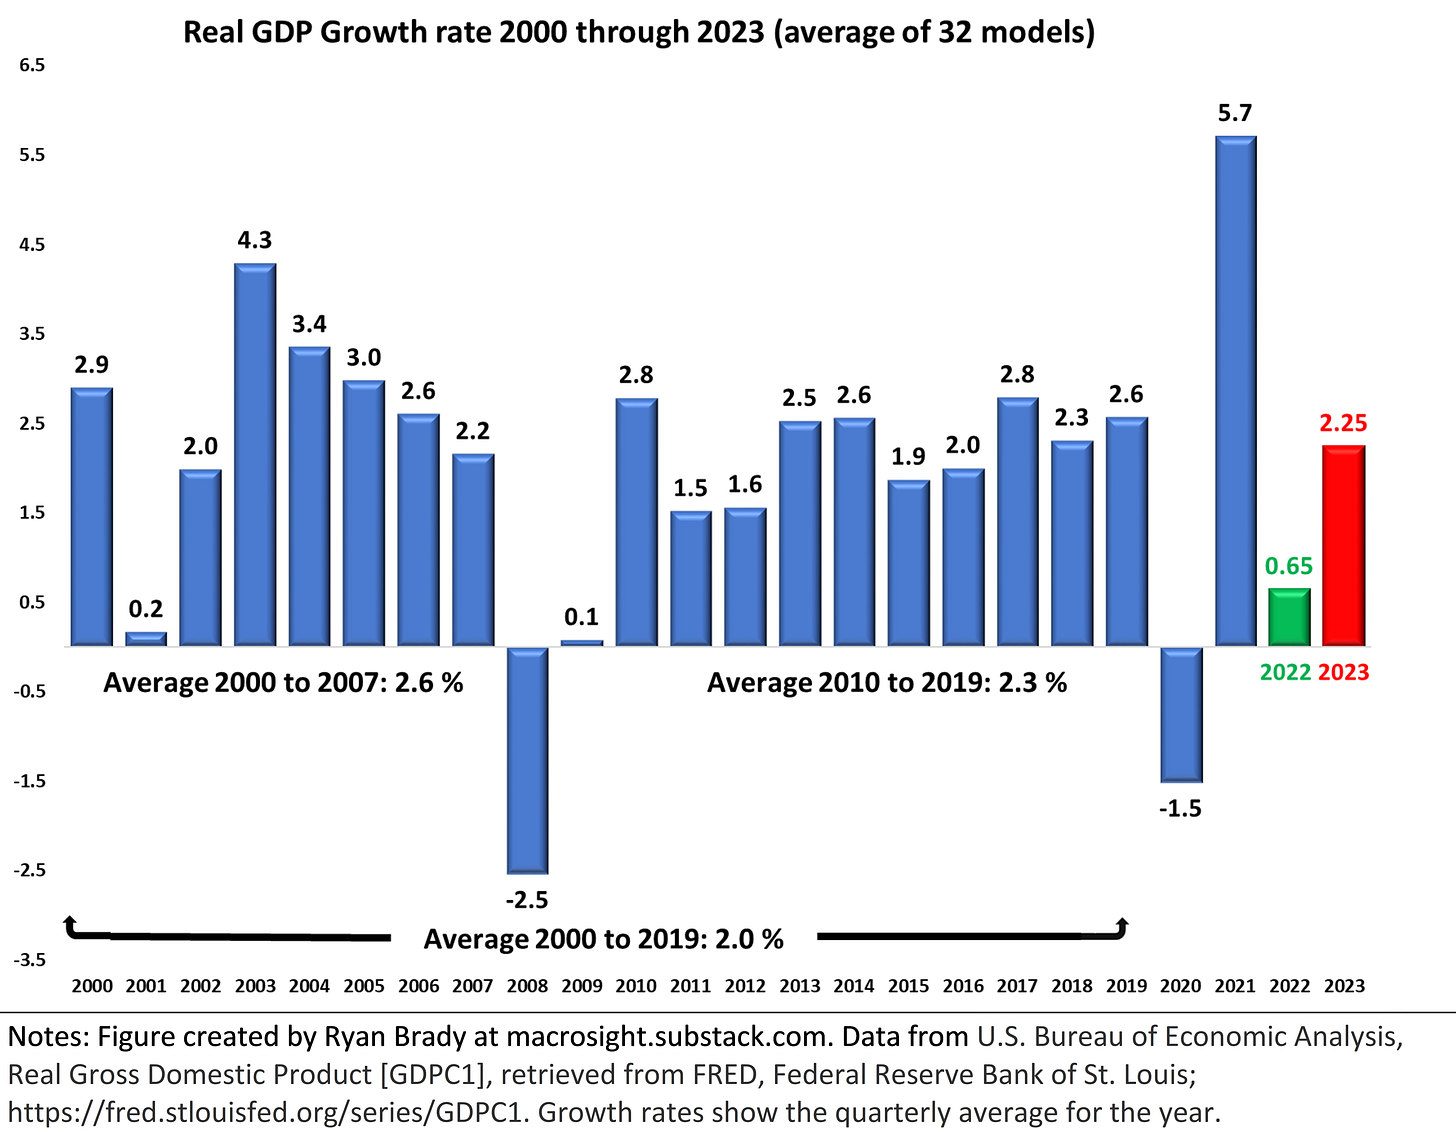
Instead of running my mouth about others’ forecasts, I generated my own, using a “benchmark” or “core” forecasting model—a model that one would learn about in an undergraduate forecasting class. More on that in a minute. Let me cut to the chase. Here is my forecast for 2022 and 2023, plotted with prior years back to 2000:
Apparently, I’m even more bullish than the Fed! While the Fed expects 2022 to end with 0.2 percent growth, my estimate is a little higher. My estimate for 2023 is even more optimistic than the Fed, at 2.25 percent compared to their 1.2 percent.
Where am I getting these projections from? I considered 32 variations of what are called autoregressive models. The key insight is that the only inputs to the model are past values of real GDP. That is, I use the values of GDP growth from the last two quarters to predict next quarter’s value. To do so, however, you have to weight those past two quarters—and, usually, the most recent quarter matters the most.
Where do those weights come from? To obtain the weights, one performs regular regression analysis on the history (back to some point) of real GDP. The idea there is that the historical fluctuations in GDP reveal how strong of a predictor (or not) the past is for the present. Also, as a forecaster, you have to decide how far back in time is appropriate for estimating that “historical” relationship. And, you have to decide how many past values of real GDP to include as inputs—doe the past two quarters matter, or is it the past four?
For an example of the 32 permutations I estimated, I estimated one model with the last two lags of GDP as the inputs, and estimated that model using data from 1985 through 2019. From there, producing a predicted value is a matter of plug and chug (using the estimated weights and the actual values of the last two quarters of real GDP). For a different version of that model, I estimated over the time period 2000 through 2019, then 2000 through 2022 (Q2), and so on. Then, I tried models with four lags of real GDP as the inputs. This process produced 32 distinct forecasts. I could have kept going, of course, but I had to cut it off somewhere.
The figure above shows the average of all of those distinct forecasts (the standard deviation for the 32 forecasted values for 2022 and 2023 equal 0.22 and 0.27 percent, respectively).
My Quarterly Forecasts: Schrödinger's 3rd Quarter
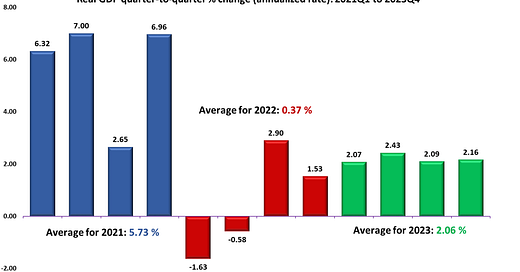
For a visual example, and a more focused view, the figure below shows the quarterly forecasts for GDP growth out through the end of 2023 (with the figure starting with the first quarter of 2021). The forecasted values are from a model with four past values of GDP growth as the inputs, and with the weights estimated from a sample period spanning 2000 through 2019.
For this particular model, the average values for 2022 and 2023 were a little lower than displayed in the previous figure (which showed the average of all 32 forecasts). This particular model predicts a sub-2 percent fourth quarter in 2022, but a relatively steady quarterly pace for 2023.
Note that for this forecast and in all of the other 31 one models, I assumed a growth rate for the third quarter of 2022, then forecasted the values for the 4th quarter of 2022 and the four quarters of 2023. For example, in the figure you will notice the value for the third quarter of 2022 is 2.9 percent.
Why did I make that assumption and where did 2.9 come from? First, I made this assumption since, as I write this, the 3rd quarter is over. Yet, we do not what that 3rd quarter growth rate will be. But, there are numerous forecasts out there that have been updated as more and more data has rolled in revealing what occurred over the third quarter. We are close to knowing, but just not quite yet. We exist in something of a Schrödinger's 3rd Quarter, if you will.
For example, the “GDPNow” forecast provided by the Federal Reserve Bank of Atlanta predicts (as of 10/19) that the economy grew 2.9 percent over third quarter—much improved over the first two quarters. The Bank also juxtaposes their forecast against a summary of many other forecasts, where the average value from those is about 1.3 percent (you can see that information here). 1.3 percent is still better than the first half of the year, but not quite as robust as 2.9 percent.
Hence, for the 32 flavors of the models I ran, I considered four values for the 3rd quarter—2.9 percent (the Atlanta Fed’s value); 1.3 percent (the “blue chip” average); and 0.0, and -1.0. The latter two values were included to consider more pessimistic outcomes. With those different values, I then generated the forecasts described herein.
A few final thoughts
The forecasts in this post were all generated from a backward-looking model. I only used historical information to project the future. You can think of this approach as a “baseline” or “benchmark” model. To add to your forecast—to make them more forward-looking—you can do something as follows:
Assume that in 2023 certain shocks hit our economy that lower or raise the baseline forecasts by a certain percentage, which provides a range of pessimistic and optimistic outcomes. You can then put some probability on the likelihood of those shocks (and their size) to get a sense of how likely those outcomes will be.
To be more specific about those “shocks,” you might focus on certain variables, such as the federal funds rate (the Fed’s key interest rate), or the price of oil.
To incorporate the federal funds rate, for example, you can include that variable in your historical model of real GDP growth. The historical data will provide you with an estimate of how the federal funds rate has historically mattered for changes in real GDP. That estimate will then serve as the weight when you generate the forecast for real GDP. In that way, you can assess how a 0.5 percent change in the federal funds rate(up or down) in the 2nd quarter of 2023, say, will matter for growth.
With respect to an oil shock, you could follow a similar process as described for the federal funds rate. In such a way you can assess how the price of oil reaching $150 a barrel, say, would matter for real GDP in 2023.
Lastly, with respect to the outlet predicting a 100 percent chance of a recession, what they are likely doing is running hundreds of models, with a more elaborate version of the models I have discussed in this post. As part of that, they are likely considering a bunch of scenarios, in a way similar to what I described just above—e.g., assume the federal funds rate goes up or down by a specific amount, the stock market increases or decreases by 20 percent, and so on. Out of all of those scenarios, it must be the case that nearly all of their models are predicting a recession.
Hopefully, it will not come to that and the world will look more like the Fed’s forecast. Or, better yet, the forecasts I have presented here.
The quote in the sub-title to this post is from the actor Paul Rudd in the movie, Anchorman.
The median value is the “middle projection when the projections are arranged from lowest to highest. When the number of projections is even, the median is the average of the two middle projections”(source). The central tendency “excludes [from the range of forecasts] the three highest and three lowest projections for each variable in each year”(source).


