

This week the BLS released the not-so-good news that the Consumer Price Index (for all items) increased by 0.5 percent in the month of January, the highest monthly increase since August 2023. On an annualized basis, 0.5 translates to almost 6 percent!1
This inflation reading comes on the heels of the alarming increase in egg prices the past month. That well-covered phenomenon is the result of a severe shortage in egg-producers, i.e., chickens.
Given the jump in the CPI in January, it is natural to wonder how much of the 0.5 percent was driven by egg prices. The answer, fortunately, is easy to figure out.2
Is the sky falling?
While the overall CPI increased by 0.5 percent in January, eggs prices went up by 15.2 percent. On an annualized basis that is about 183 percent!
Two questions:
Is the recent increase in egg prices unusual?
If egg prices went up that much, why did the overall CPI only increase by 0.5 percent?
Figure 1 displays the CPI-measured rate of inflation for average egg prices from January 2000 through January 2025. The CPI for eggs, like the CPIs for used and new cars analyzed last week, is a distinct price index, representing a sub-component of the overall CPI, which is also displayed on Figure 1 (the CPI for all items).
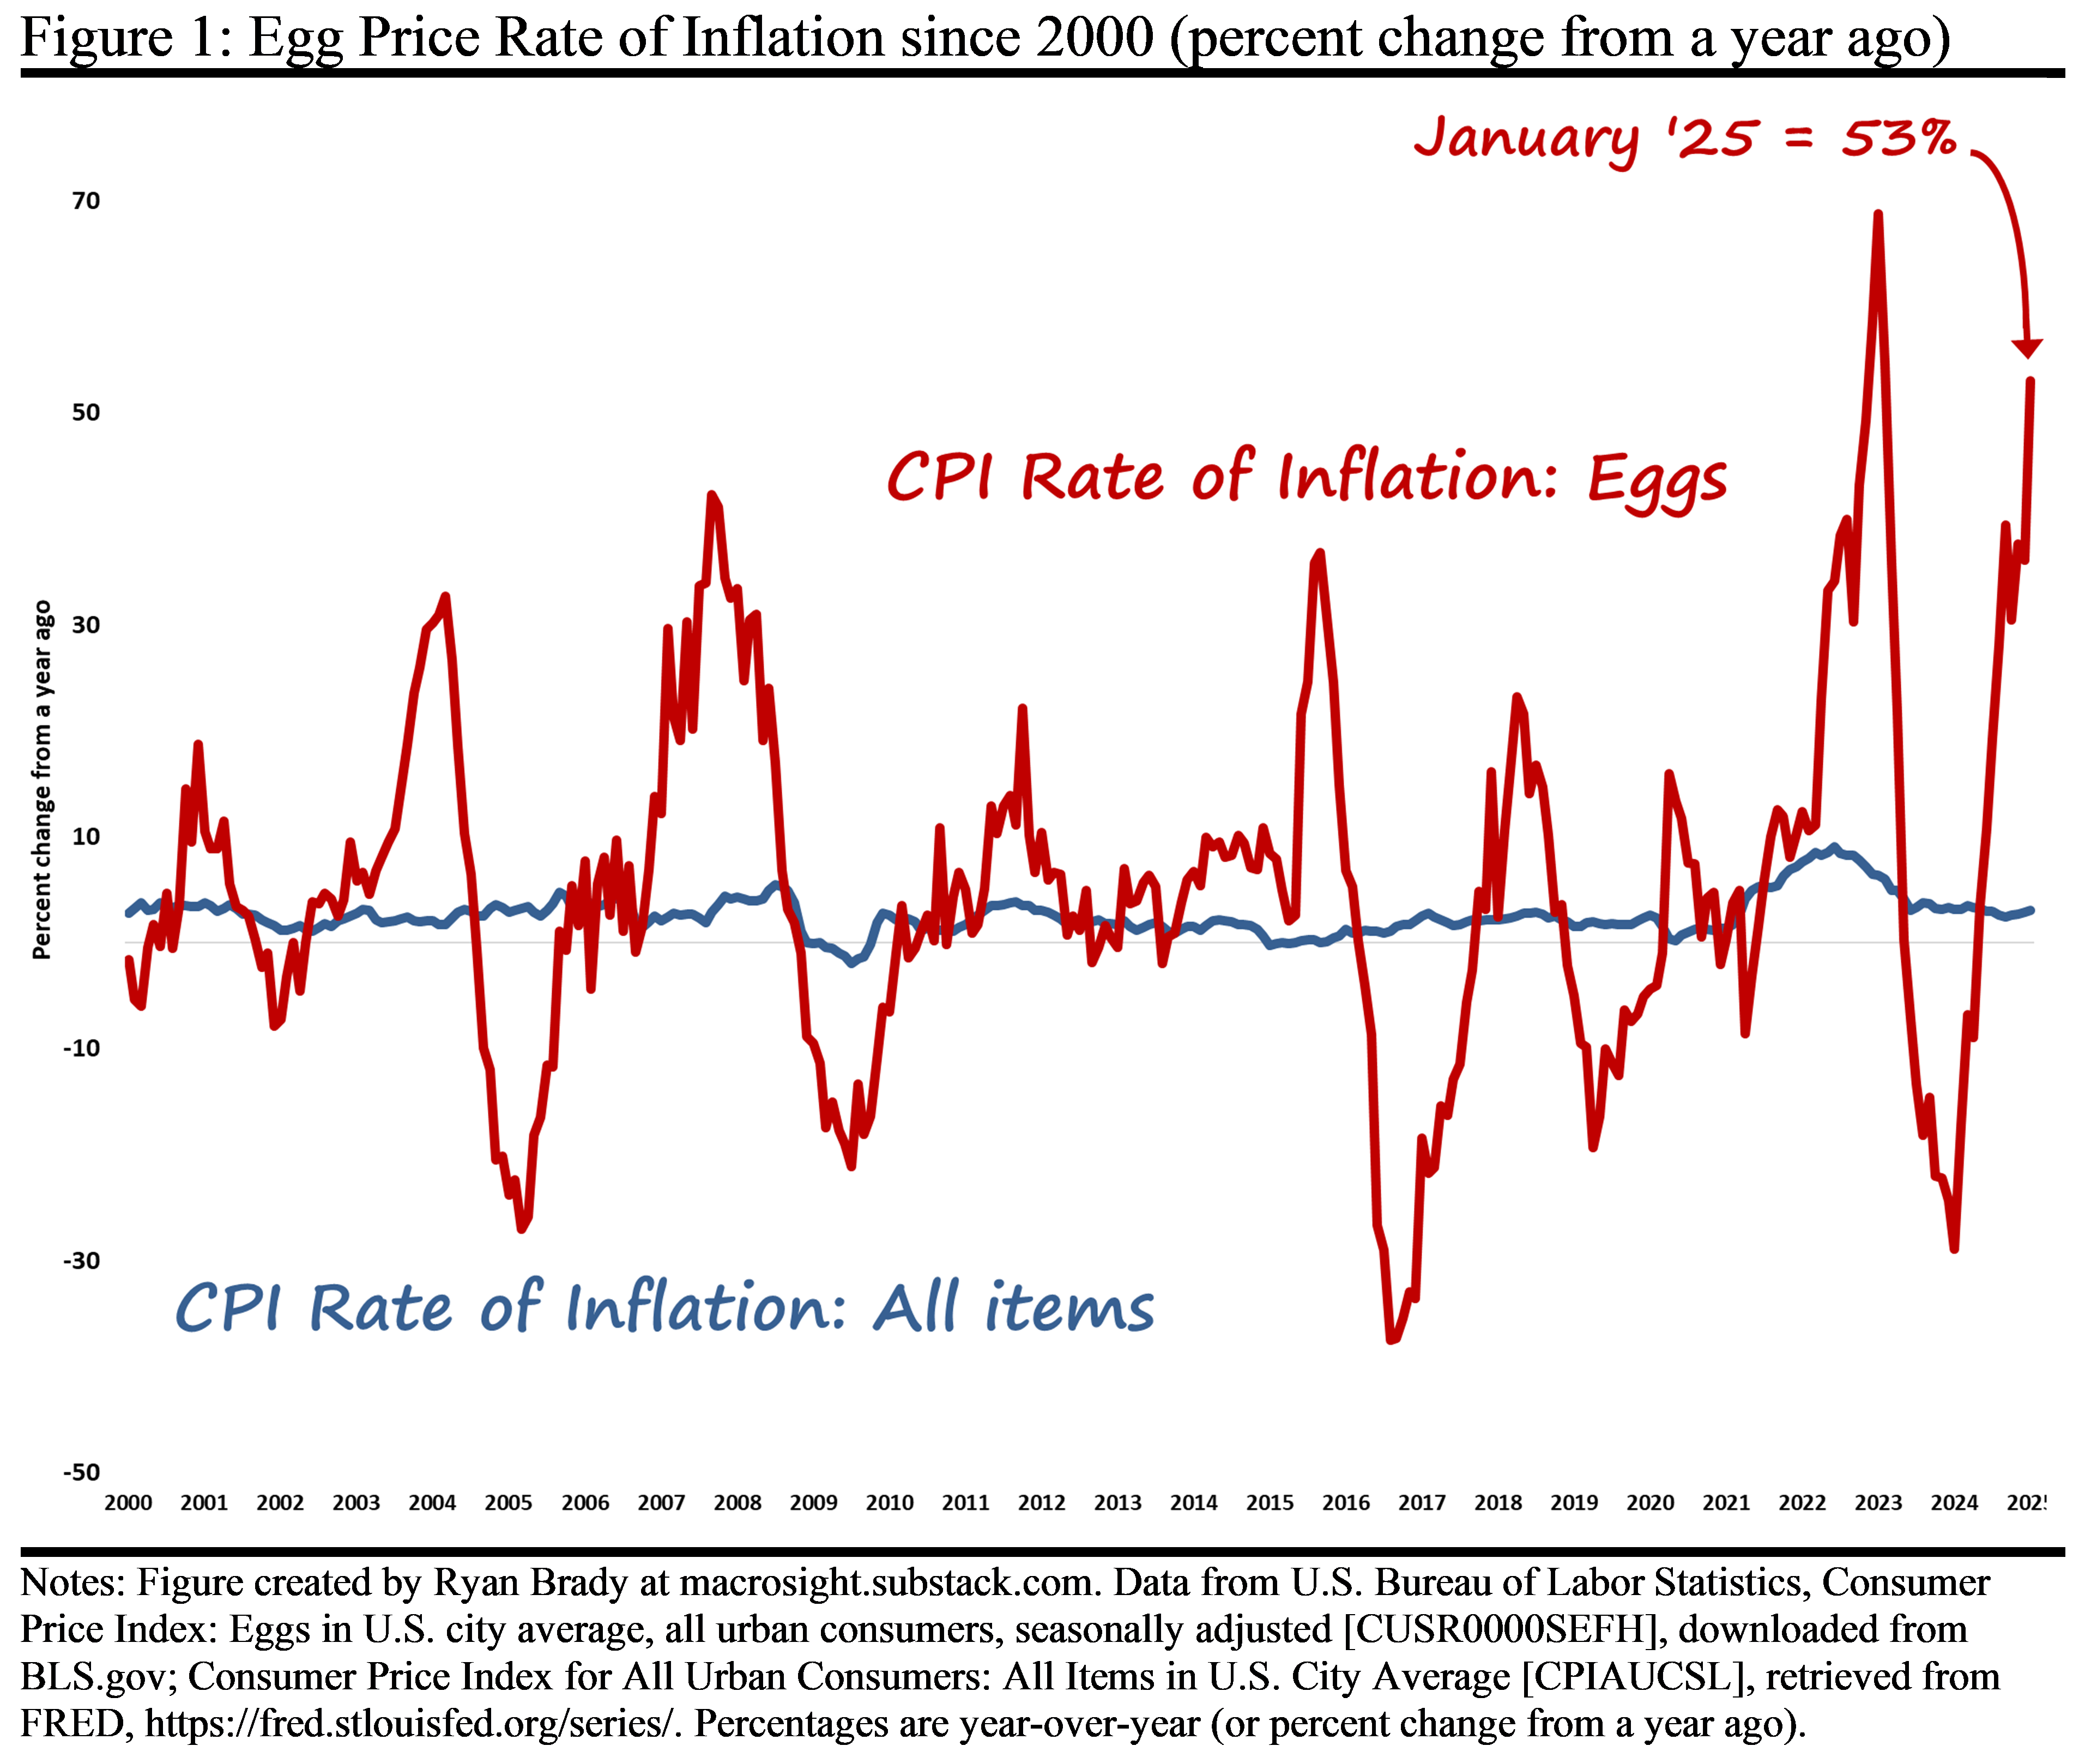
Over the last twelve months, egg prices increased 53 percent, which represents the second-highest increase since 2000 (the highest, 69 percent, occurred over the twelve months ending with January 2023). The 15.2 percent month-to-month change for January mentioned earlier is also the second-highest month-to-month change since 2000. In June 2015, the month-to-month increase was just over 18 percent.
So yes, egg prices have increased dramatically, and have done so twice in the past couple of years. Yet, if one looks at the history of changes in egg prices, as displayed in Figure 1, it is obvious that large fluctuations, up and down, are not unusual.
Chicken little
Eggs are but one expenditure category in the “basket of goods and services” tracked by the CPI. Recall, the “all items” CPI, the Consumer Price Index for Urban Consumer—technically the “CPI-U”—represents a national average that tracks the prices of about 80,000 goods and services across 75 “urban areas” (see here for more detail).
The 80,000 goods and services are categorized in 200 (or so) expenditure groups (as explained via this FAQ page). “Eggs” is one of those categories.3
So, if the CPI-U increased 3 percent over the past 12 months, how much of that 3 percent was accounted for by the dramatic egg inflation?
To answer this the BLS provides a measure of “relative importance” of each item in the CPI-U. This statistic is explained in detail here by the BLS, but the gist is—and here I am paraphrasing—the relative importance of a item (e.g. eggs) is its value weight, which represents a household’s average annual expenditure on a that item, as a percentage of all expenditure tracked by the CPI-U.4
The relative importance of eggs in the CPI-U in December 2024 equaled 0.172, out of 100. That value is relatively small, compared to other types of items, which makes sense.5 The typical household is likely only spending a small share of its income on eggs in a given year. But, small number or not, we can still derive the impact of egg inflation on the CPI-U rate of inflation.
Ultimately, the 53 percent increase in eggs prices from January 2024 to January 2025 amounted to only about 2 percent of the 3.0 percent increase in the CPI-U over the past twelve months—or, about 6 basis points of the 300-basis point increase of the CPI-U.6
While 53 percent is certainly a very large price increase in one year, as far as its impact on the overall rate of inflation, the impact is pretty poultry.7 That is not to claim, of course, that the combination of higher egg prices and restricted supply is not a complete pain in the neck for egg-eaters. At least it has been for Macrosight.
Recall that “annualized” means “if this monthly change is repeated for 12 months, this is what the annual change will equal.” On a slighter more optimistic note, the “percent change from a year ago” value reported by the BLS for January was “only” 3 percent.
As it turns out, it was not as easy as I thought.
I could not find on the BLS website exactly how many different types of eggs are tracked, which then make up the category “eggs.” According to a generative-AI platform, “eggs” includes all types of eggs by grade, color, organic or not and so on. Hence, the egg specific price index shown in Figure 1 represents an average of all types of eggs.
The BLS describes relative importance as follows: “The relative importance of a component is its expenditure or value weight expressed as a percentage of all items within an area or an area within the U.S. When the value weights are collected, they represent average annual expenditures, and their relative importance ratios show approximately how the index population distributes expenditures among the components.”
One can download an excel file from this page containing the relative importance measure for every expenditure category. For example, the relative importance of new and used cars, the subject of last week’s post, equaled 4.393 and 2.391, respectively, in December 2024
I calculated this estimate following the instructions found at this link. Specifically, I followed Table B, using values for January 2024 and January 2025. To be frank, it was a bit tedious and took me longer than I expected when I started this post.
Sorry, paltry. Couldn’t resist.