


The rapid rise and fall of car-price inflation provides a perfect snapshot of our now-four-year long odyssey with the rate of inflation. Prices went up fast, kept going for a couple of years, then disinflated.1
In spite of the latter, the frustration over now-permanently higher prices will not go away.
The Rise
Figure 1 displays the CPI-measured rate of inflation for used cars and new cars separately from January 2020 through December 2024. The CPI for used cars and the CPI for new cars are distinct price indexes, representing sub-components of the overall CPI (the CPI for all items).2

In one year—from June 2020 to June 2021—used car prices increased by 45 percent! And for the next 12 months the monthly year-over-year increase averaged 30 percent!
In terms of dollars and cents, a used car that would have cost $20,000 in mid-2020 was selling for a little over $32,000 by early-2022.
For new cars, the jump in inflation started a little later and was less dramatic (relatively speaking), yet was still very high and sustained. From mid-2021 through late-summer-2022, year-over-year inflation of new car prices averaged about 15 percent.
The Fall
By late-2022, however, the prices of both new and used cars started to calm down.
In 2023, the rate of inflation for new cars averaged 3.8 percent; in 2024, the price of new cars fell by 0.6 percent.
The price of used cars has been deflating for the past two years, falling 7.1 percent and 5.9 percent in 2023 and 2024, respectively. This deflation is evident in Figure 1 where the year-over-year rate of inflation for used cars turns negative in late-2022, and has remained negative ever since.
This deflation can also be seen by looking at the index values of these Consumer Price indices, displayed in Figure 2. For a longer historical perspective Figure 2 plots these series back to 2000.
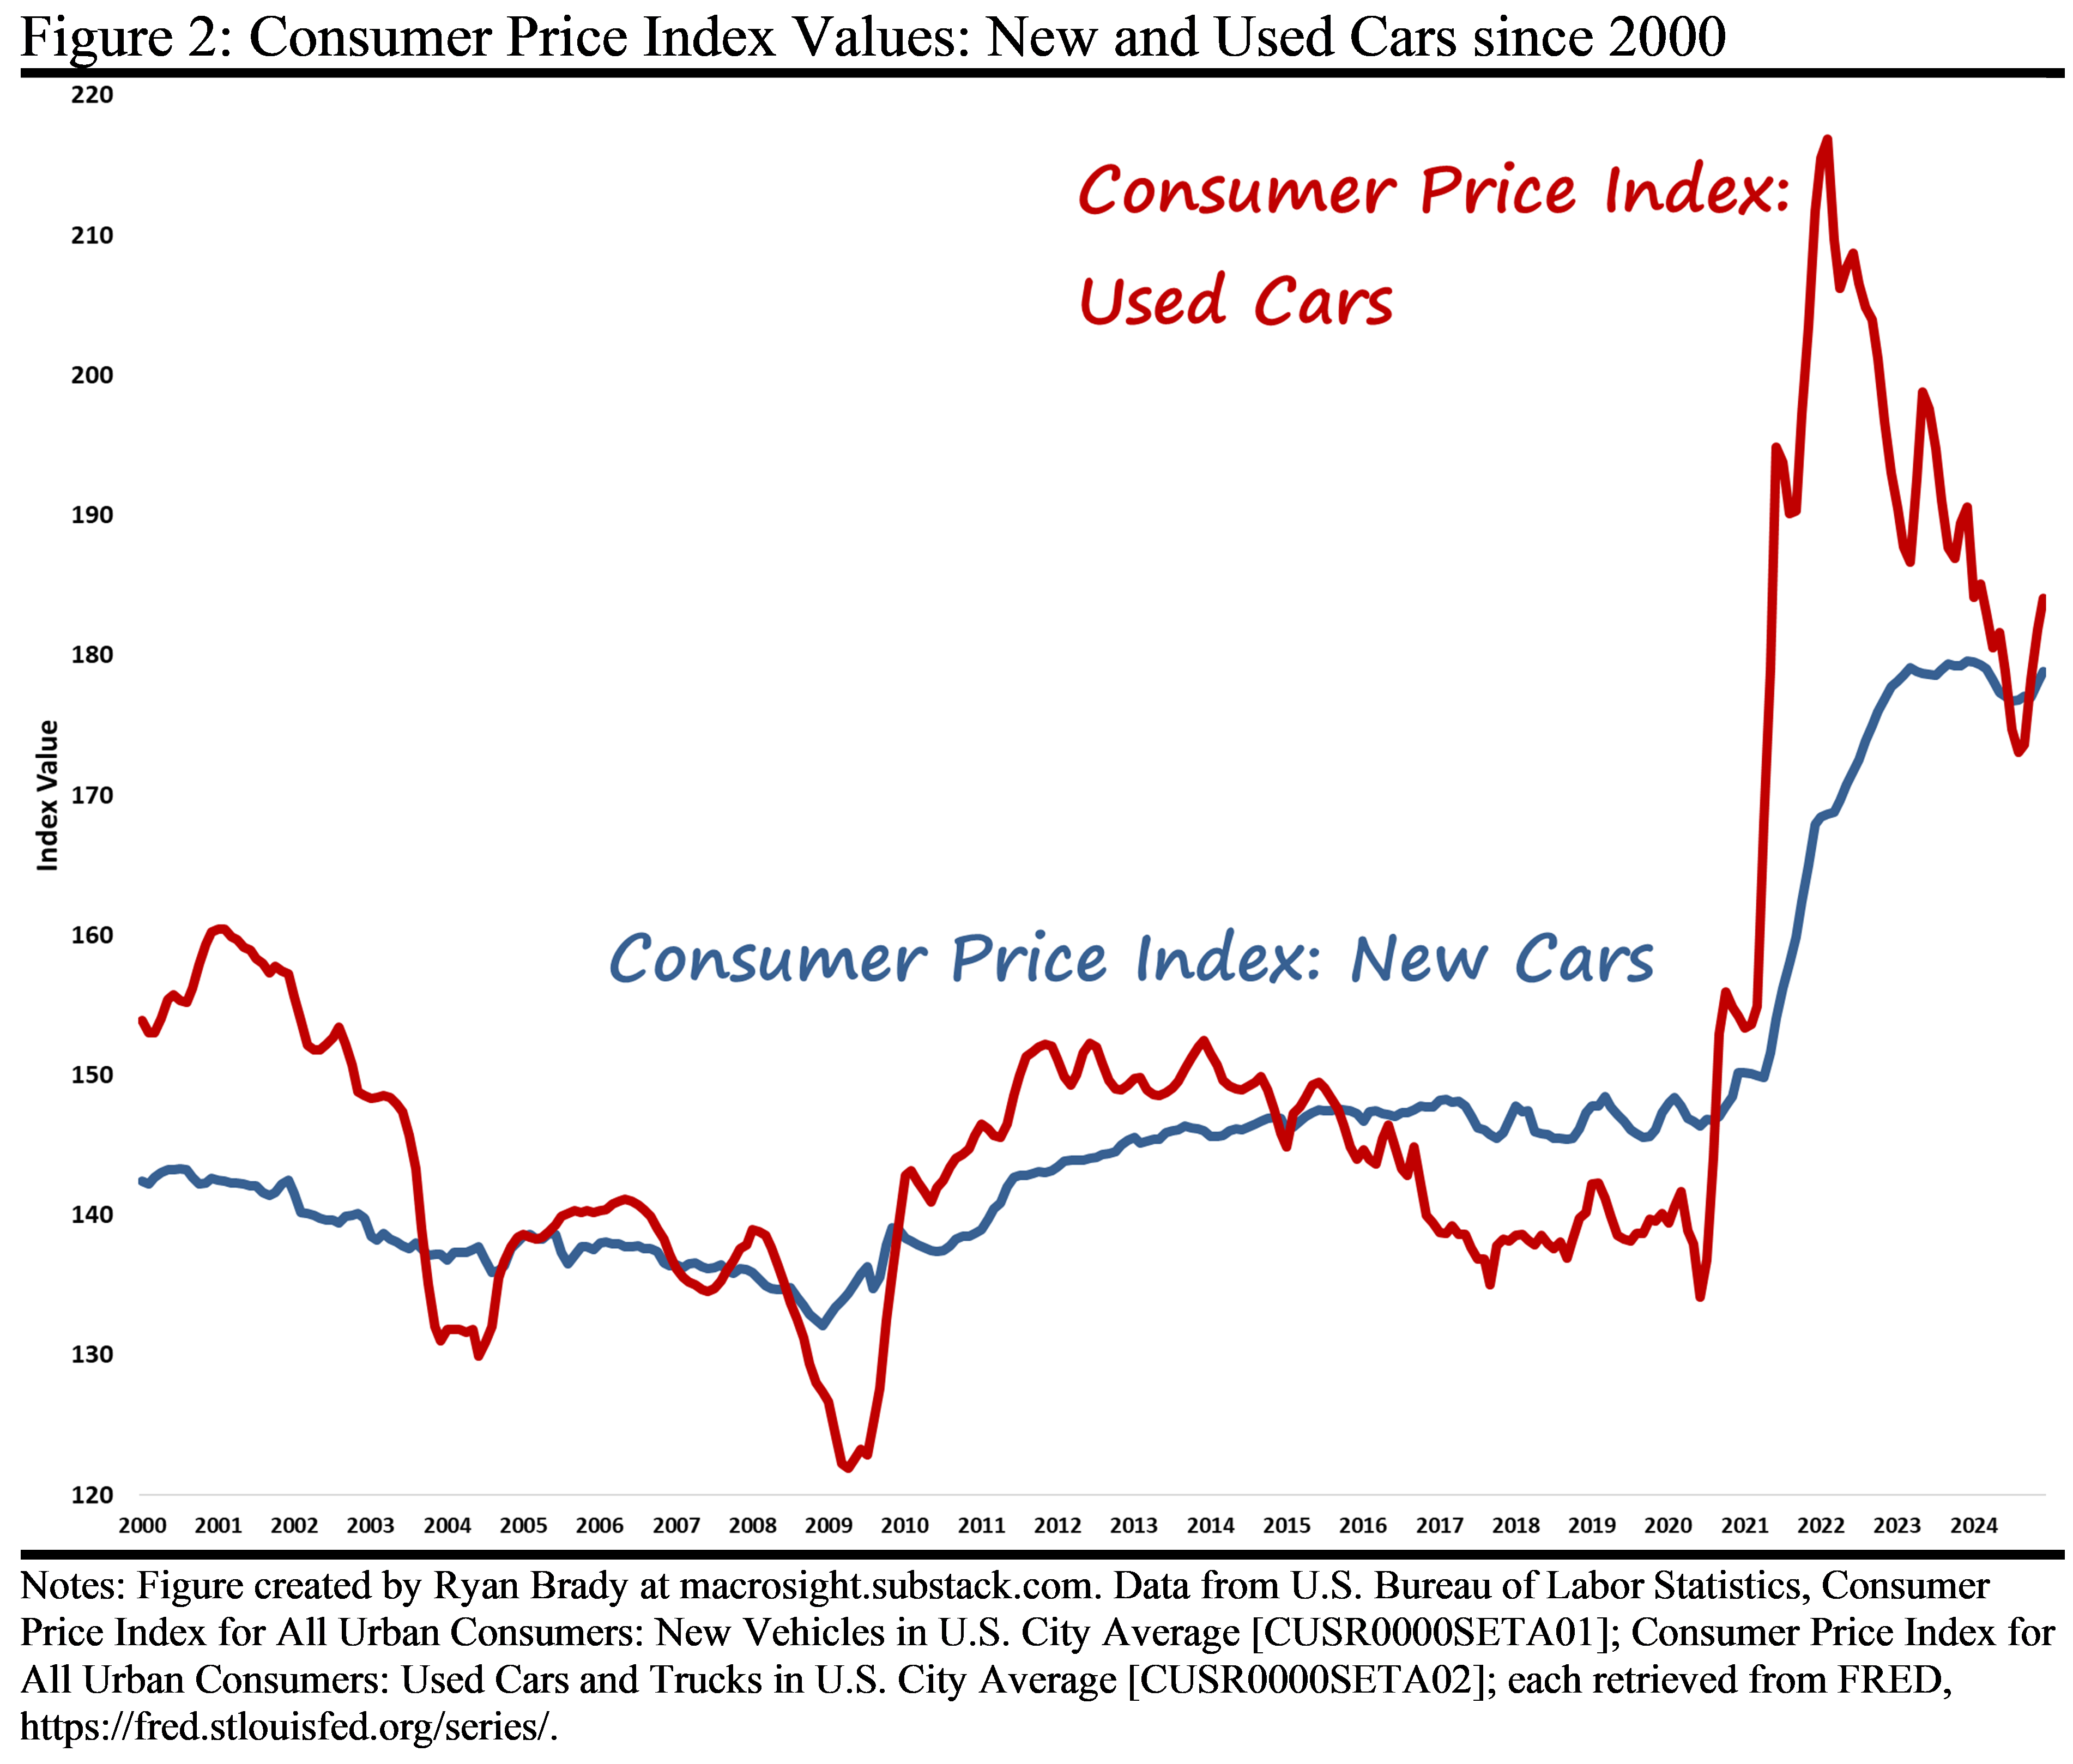
The price index values help underscore the frustration with inflation. Even if the rate of change declines (a disinflation), the price of the goods and services we buy, on average, are still higher than before.3
Notice in Figure 2 the decline in the CPI for used cars starting in early-2022. From that peak (in February 2022), the average price of used cars has fallen a total of 15 percent (through December 2024). But, the average price of a used car in December 2024 is still 31 percent higher than the average price in December of 2019.
The Frustration
We live in a world where prices always go up (for reasons explained here). However, as long as those increases are relatively small and stable over long periods of time, we do not notice the higher prices as much.
The history of car prices shown in Figure 2 embodies that idea. For used cars, the average monthly rate of inflation from January 2000 through December 2019 equaled a negative 0.3 percent. The average monthly new car-inflation over that twenty-year time span equaled a tepid 0.1 percent.4
Compared to that history, the experience of the last four years is all the more jarring. That history is captured in Table 1, which shows the average rates of inflation for new and used cars for each of the past five years, and before and after 2020. Those changes, too, are compared to the average rate of inflation for the CPI for all items.

The top-five rows highlight clearly the volatility and drama related to inflation the past four years—especially for used cars. The bottom two rows emphasize the historical comparison. The increase in prices the past few years is frustrating unto itself. Compared to what transpired the previous four years makes it all the more exasperating.
The Bureau of Labor Statistics calculates the Consumer Price Index along with its many permutations, as explained in detail in this Macrosight post. The “all items” CPI, the Consumer Price Index for Urban Consumer (CPI-U), represents a national average that tracks the prices of about 80,000 goods and services across 75 “urban areas” (you can read about how the CPI-U is created and how the prices are tracked here). New cars and used cars are sub-categories within the all-items basket of goods.
The “new cars” price index is technically “new vehicles” and includes “subcompact, compact or sporty, intermediate, full, and luxury cars . . . pickup trucks, vans, and specialty vehicles; specialty vehicles include sport and cross utility vehicles”(BLS.gov). The “used cars” index—as I am calling it in this post—also includes used trucks. “Used” is defined by the BLS as any car or truck two to seven years old.
Macrosight compares price index values to the rate of change of an index (a.k.a, the rate of inflation) in this post.
If you measure the percent change of each index from the beginning to the end of those twenty years, the average price of a new car in December 2024 was only 3.5 percent higher than in January 2000. The average price for used cars was 9 percent lower!