

It has been 5 years since Covid-19 put its disruptive and destructive imprint on our economy and everything else. Consumer spending fell by almost 7 percent in March of 2020. In April of that year it fell again by another 11 percent.
A 11 percent drop in one month implies that if consumer spending would have kept falling by 11 percent every month the rest of the year, then total consumption would have fallen by another 56 percent by the end of December.1
That would have been extremely bad, to state the obvious. Amazingly, as dire as things seemed in the early spring of 2020, consumer spending and the economy rebounded quickly. That experience has been well-covered by Macrosight, but it’s worth it to revisit that experience as a way to understand where we have been since and to better understand consumer spending here in the early part of 2025.
Spending Then and Now
Figure 1 displays the month-to-month percent changes in consumer spending going back to 2000 (data adjusted for inflation). The two-decades prior to 2020 is shown in blue, 2020 in red, 2021 in green, and then everything since in blue again.
The years 2020 and 2021 are highlighted since those two years were remarkably anomalous for spending. While the monthly average for 2020 came out to zero percent, the volatility of that year was historical.2 The year 2021 was historical, too. By the end of 2021 consumer spending had increased by over 7 percent relative to the end of 2020, which represented the second-highest one-year increase in consumer spending since 19593.
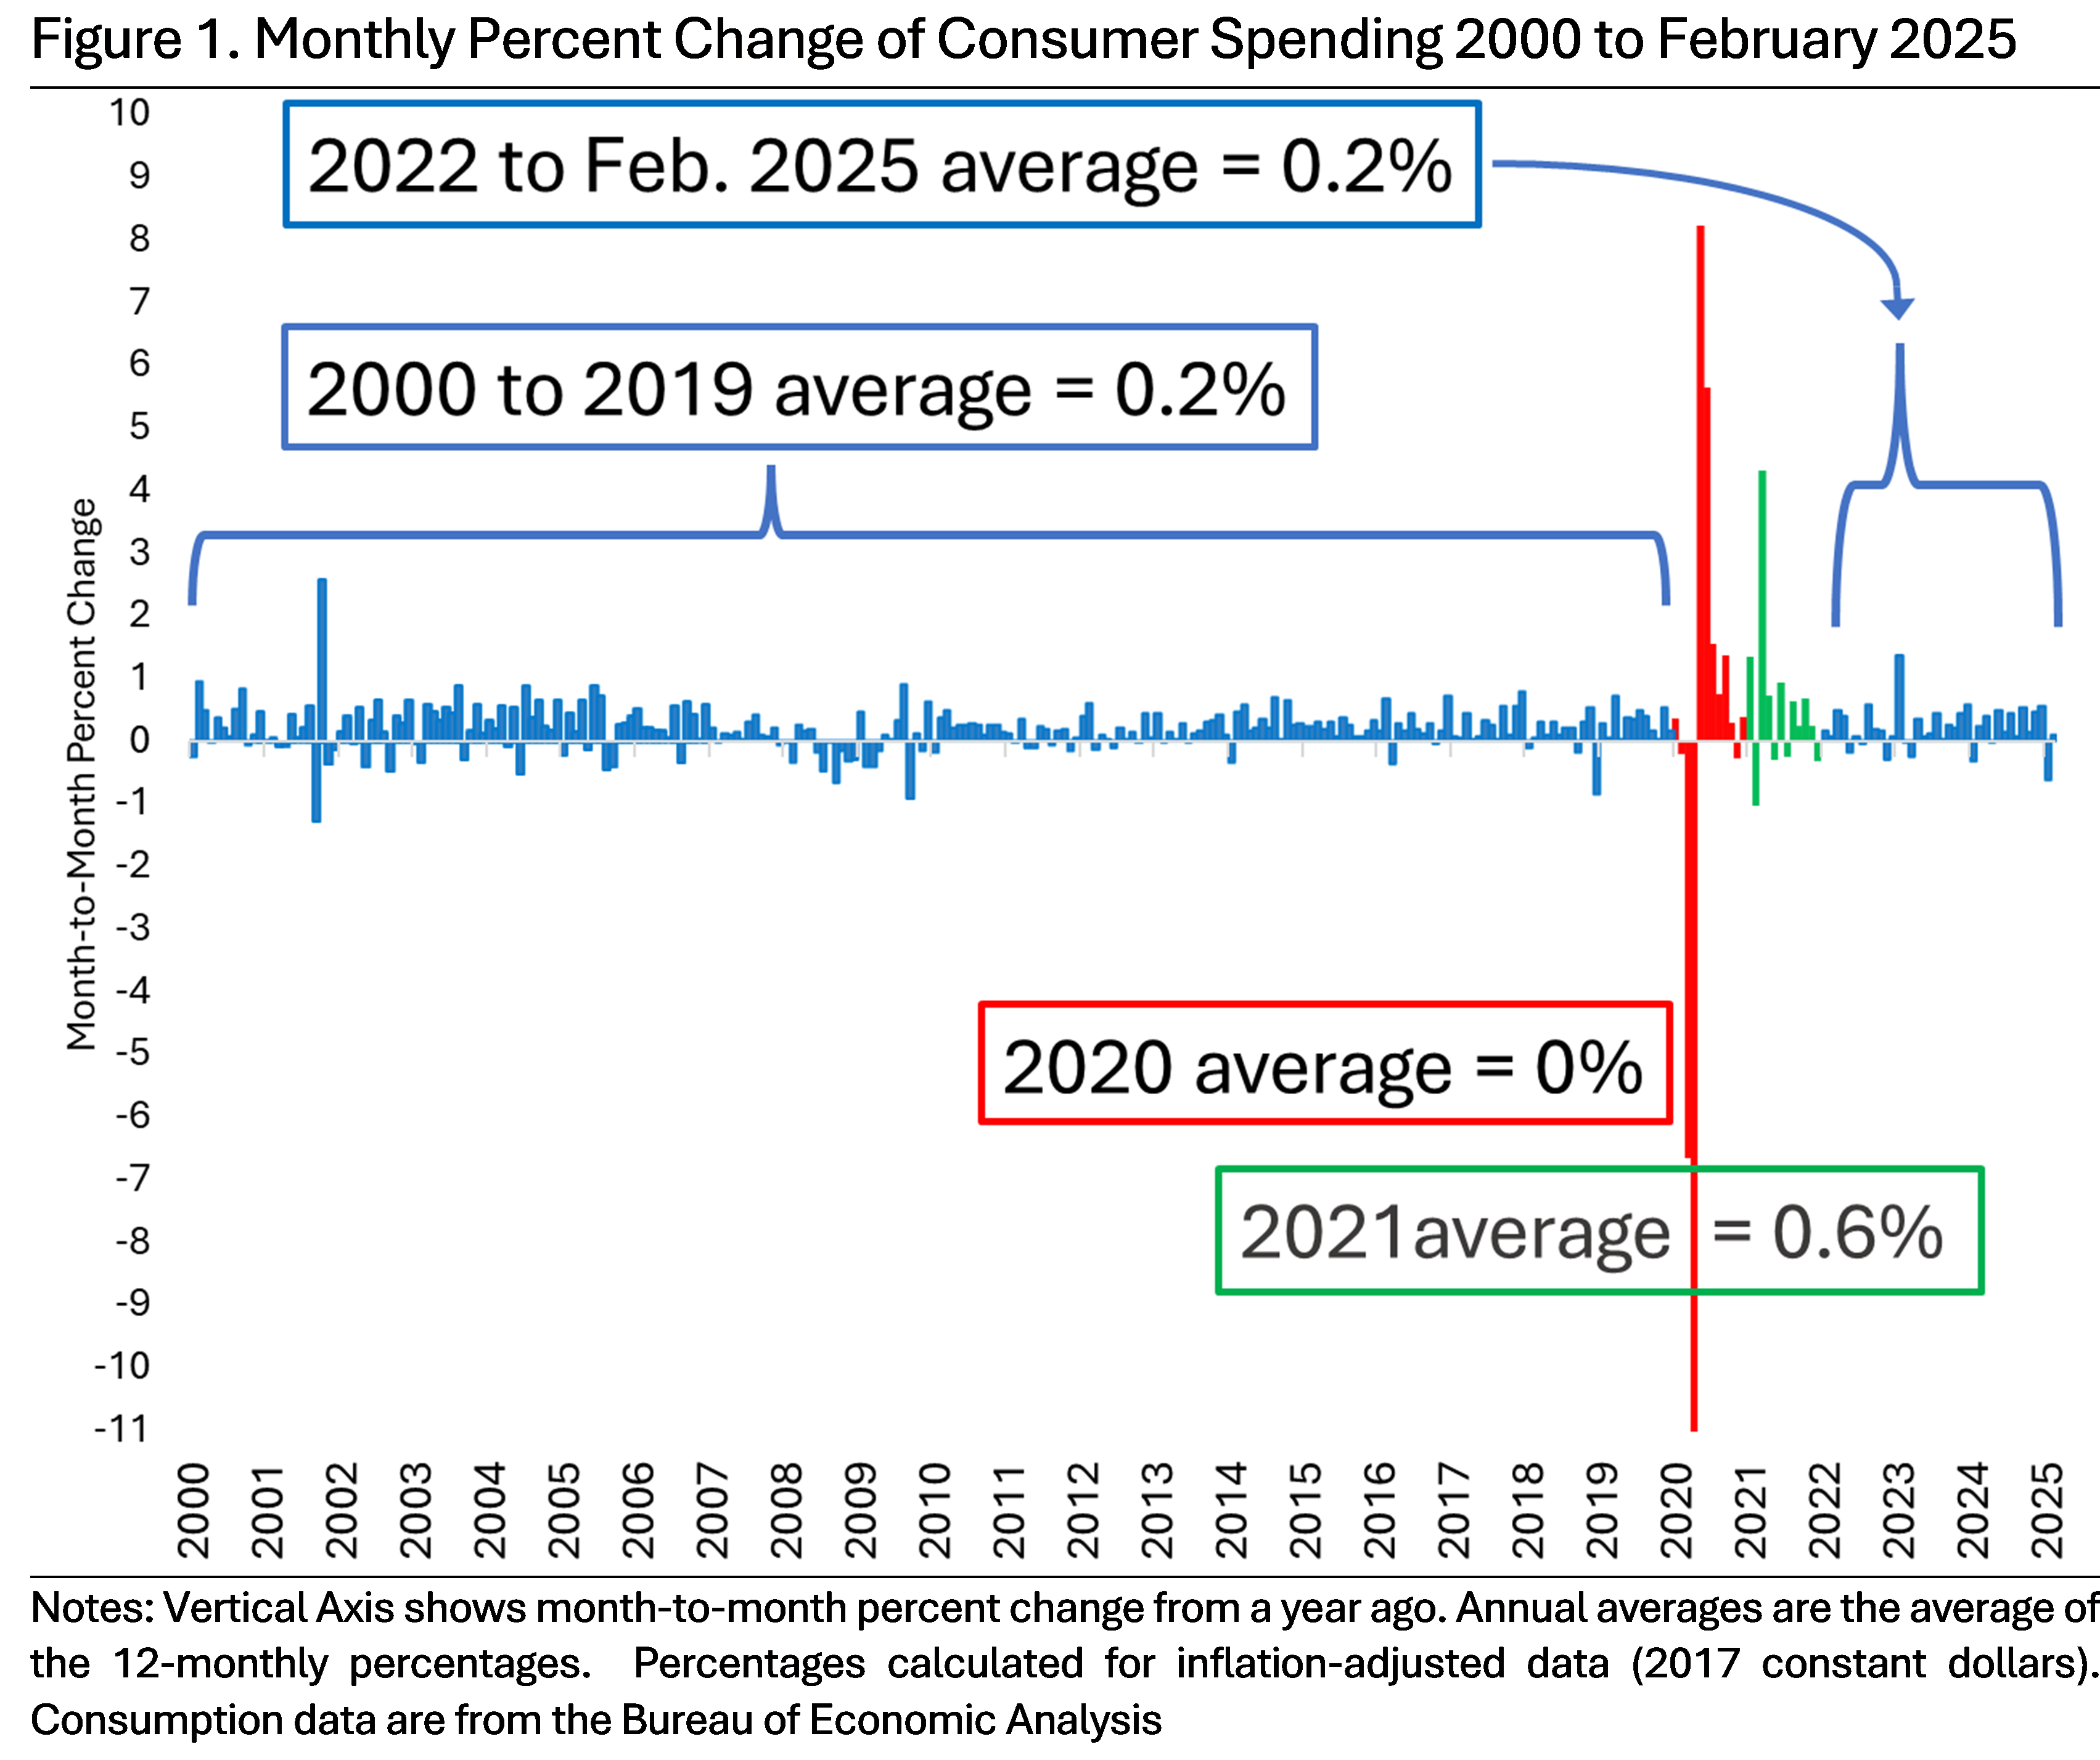
Consumer spending prior to 2020 was relatively calm (even with the Great Recession smack in the middle of those two decades). There was only one noticeable large positive jump in that time span (in October 2001) like we saw in 2020 and 2021. There is no comparable drop like we saw in 2020 (the biggest previous drop of -1.3 percent was in September of 2001). The average monthly change equaled 0.2 percent over this two-decade period.
If we take the 2000 to 2019 period as the historical “normal,” that implies consumer spending in 2021 was three times that normal. And of course, the monthly jumps that occurred in 2020 were clearly abnormal.
Which brings us to the present. Consumer spending fell by 0.6 percent in January. Such a decline is notable. Since 2000, there have only been eight months with declines of 0.6 percent or greater. Spending did rebound a bit in February, coming in at a positive 0.1 percent (data for February was just released this morning by the Bureau of Economic Analysis).
Yet, the fact consumer spending rebounded in February is not surprising. That is normal for consumer spending. And, since the beginning of 2022, consumer spending has been just that, normal. As annotated on Figure 1, from January 2022 through this February, spending has averaged 0.2 percent, just like in the two decades prior to Covid-19.
To further understand normal consumer behavior, Table 1 separates out three levels of month-to-month consumer spending growth: 1) the number of times consumer spending has increased more than 1.0 percent in a month; 2) the number of times spending has dropped more than 1.0 percent; and 3) and the number of times spending has fluctuated within negative 1.0 percent and positive 1.0 percent.4
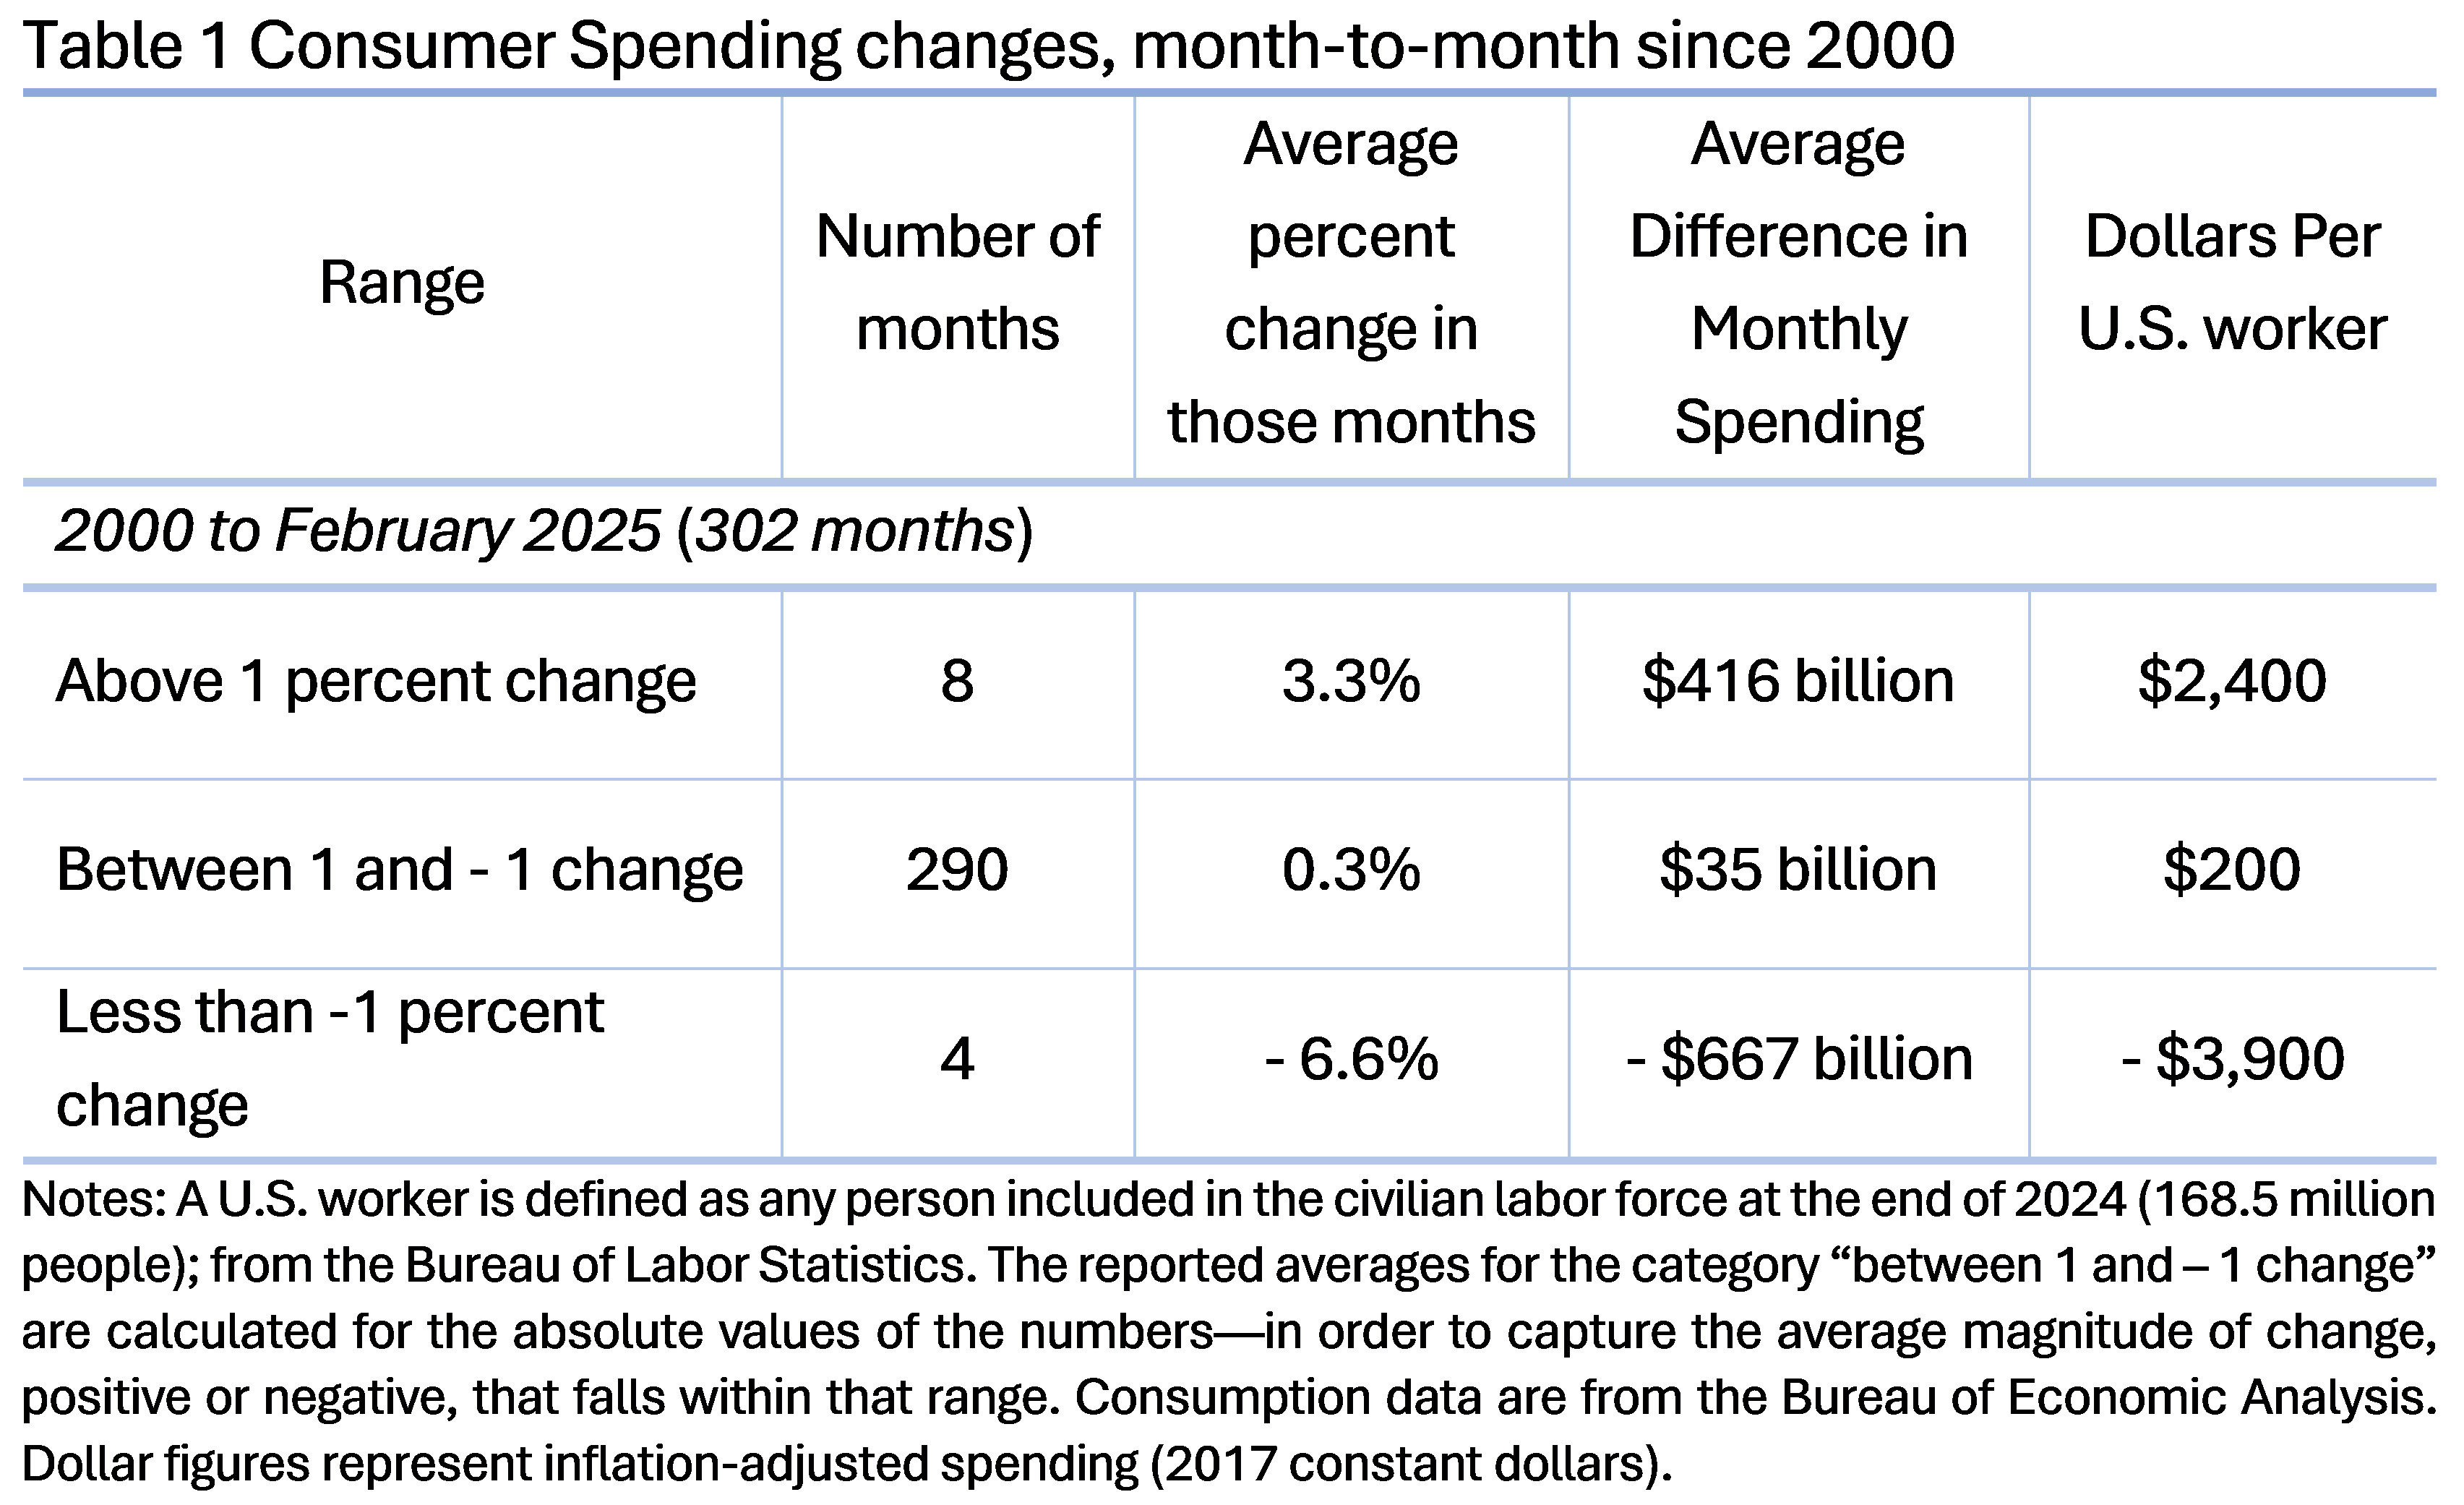
In the 302 months since 2000, there were only eight months when consumer spending growth exceeded 1 percent. Six of those occasions occurred in 2020 and 2021. The average increase over those instances equaled 3.3 percent. And, reading further across the row, the dollar amount of those increases averaged $416 billion. To put that in per worker terms, that means that on average each worker in the U.S. economy increased spending by about $2,400 during those booming months, which is a heck-of-alot!5
For the converse, there have only been four instances of one percent declines or more. Two of those months were March and April of 2020; another such drop occurred in 2021; and the remaining one occurred September of 2001. Those declines averaged almost 7 percent and the average worker cut consumer spending by almost $4000.
How do those more dramatic ups and downs compare to normal consumer behavior? Out of the 302 months since 2000, there have been 290 occasions where consumer spending fluctuated between negative 1.0 and positive 1.0 percent. That implies consumers typically increase or decrease consumer spending by $208 month-to-month.
Overall, Table 1 reveals a remarkable fact. Over the past 25 years, month-to-month consumer spending is stable and steady.6 That is our normal.
Now versus Then
From January 2022 through February of this year—a total of 38 months—we have had one month where consumer spending increased more than 1 percent and zero months where it declined more than one percent.
The negative 0.6 percent drop this January is the largest drop of those 38 months. That value is also about two-standard deviations away from the average for this time frame; so -0.6 is certainly cause for concern. Yet, as already noted, at least consumer spending reversed course in February.
From a forecasting perspective, that consumer spending has been “normal” since 2022 implies our best guess for this month and beyond is more of that normal. Such a claim may beggar belief for some. Depending on how you view events these past two-plus months, you may assume that we are living in abnormal if not exasperating times. Yet, over the 302 months chronicled above, there have been a plethora of abnormal, contentious and concerning events. The American consumer perseveres nonetheless.
At the end of April 2020, inflation-adjusted consumer spending equaled $12.2 trillion. With 11 percent declines in every month thereafter, on December 31 the total would have stood at $4.8 trillion. The last time total consumer spending equaled $4.8 trillion in the United States was 1983 (again, these are inflation-adjusted dollars).
The sample standard deviation of month-to-month percent change of consumer spending from 2000 to February of 2025 equals 1.04 percent. The sample standard deviation for the 12 months of 2020 equaled 4.99 percent.
Monthly data on consumer spending begins in 1959. Since that date, the biggest one-year increase of 7.9 percent occurred in 1965.
These divisions are somewhat arbitrary. On the hand, as noted already, the standard deviation of consumer spending growth over this period is 1.04 percent. In that respect, the +1 and -1 cutoffs are not arbitrary—if the growth rates were perfectly normally distributed then 68 percent of all months would be within those ranges. But, this series is not exactly normally distributed and 92 percent of all observations are within the one-standard deviation (the distribution looks more leptokurtic). So, outliers are less common than in the case of normal distribution.
Per worker is based on the total number of persons counted in the labor force for the United States at the end of 2024 (data from the Bureau of Labor Statistics). While, the population of the U.S. and the number of people working has increased over the time periods shown in the table, I use 2024 labor force numbers to provide a simple snapshot for us, so we can wrap our heads around what these numbers mean in practical terms.
If we look further back in time to 1959 (when we first have monthly data on consumer spending), we see that “normal” goes back decades. In 733 out of 793 months—or 92 percent of that history—spending oscillates within the plus and minus one percent range. The average with that range is 0.4 percent, and the average change in month-to-month spending equals $154. Declines below 1 percent only occur 2 percent of the time (14 out of 793 months), while increases over 1 percent happen only 6 percent of all months (46 out of 793).