


Prices fell in March. As announced yesterday by the Bureau of Labor Statistics, the inflation rate for March came in at about negative 0.05 percent. On an annualized basis the number comes out to about -0.6 percent.1
On the one hand, that is good news. That means on average, across the 80,000 goods the CPI price index tracks, prices fell at least just a little bit.
This is only the third month in the last four years that we have come close to a negative rate—or, a deflation. These rare occurrences can be seen in Figure 1, which displays the CPI for all items along with the CPI excluding food and energy, a.k.a., the “core” CPI (both metrics are discussed in the BLS’s monthly news bulletin on inflation). The time span shown begins in January 2020 and runs through March of this year.
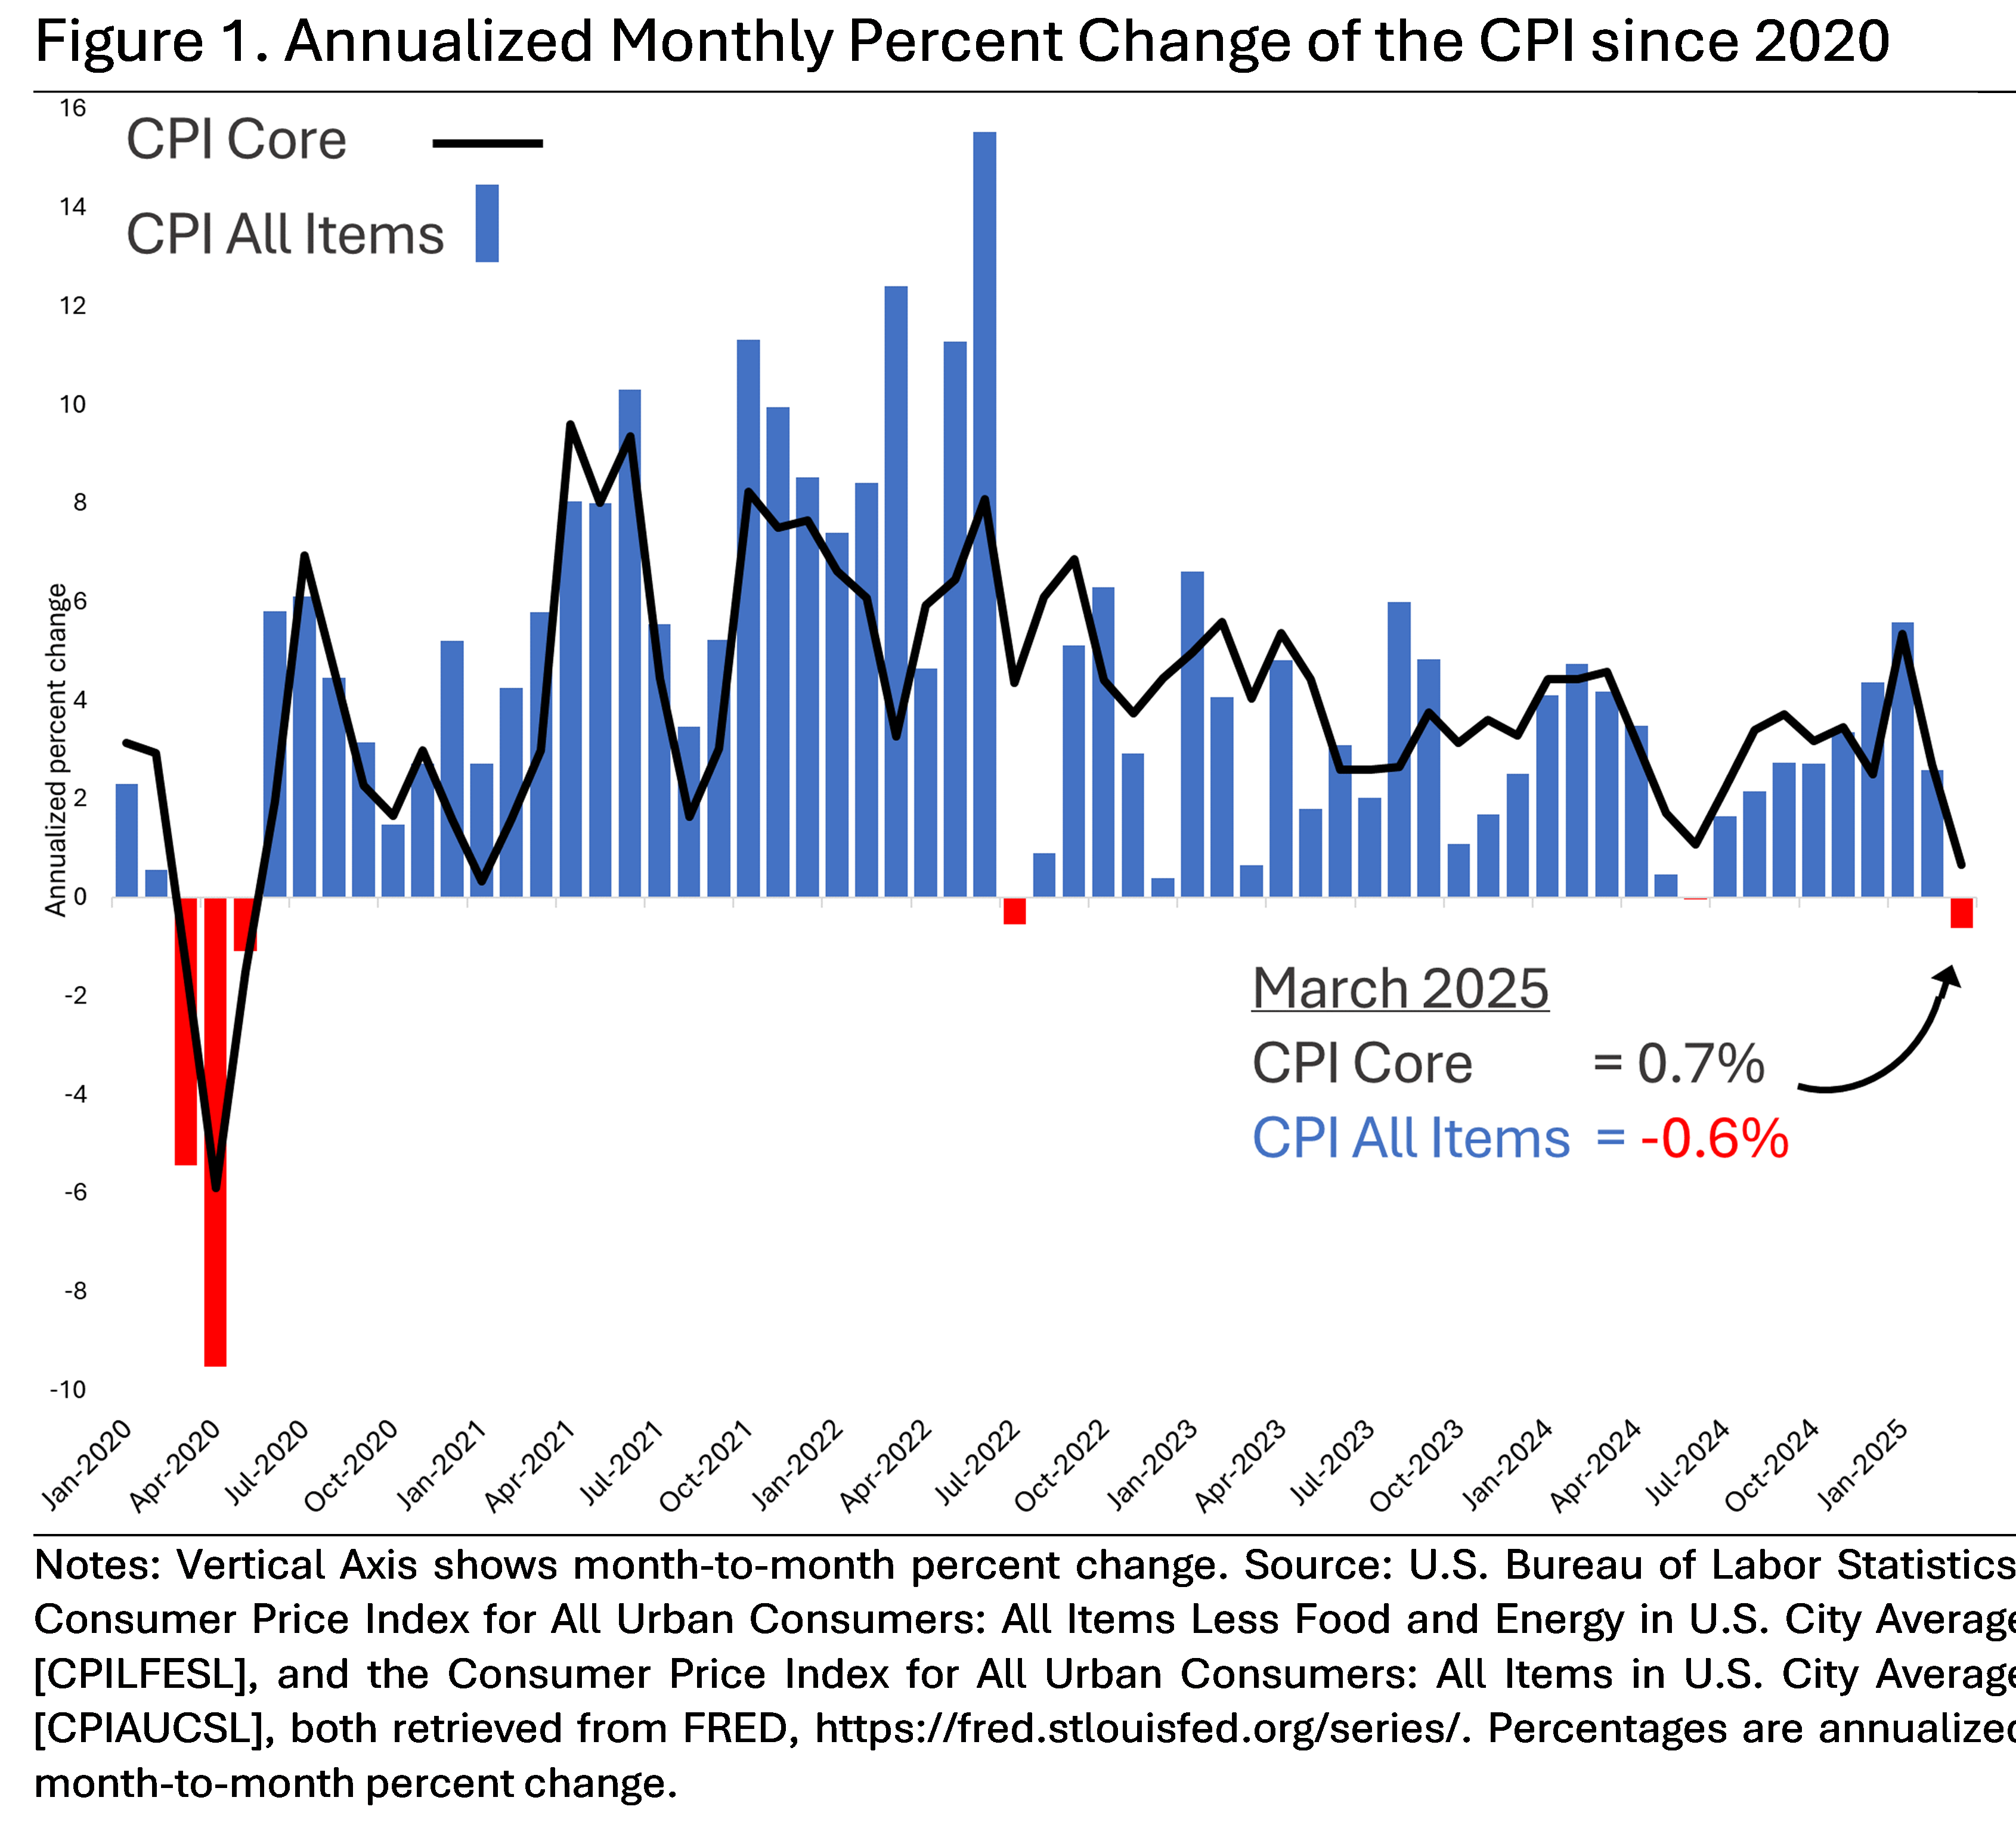
The last time the monthly rate of inflation was negative was last June, when the CPI for all items was -0.03 percent annualized (which is essentially zero percent); before that was in July of 2022, which is the lone red bar in the middle of the timeline. Prior to that, the last time we had deflation was amidst the onset of the Covid-19 pandemic.
Historically, it unusual to have a month-to-month deflation. Since 2000, for example, the CPI-all-items index has only fallen in 50 out of 303 months. That means only about 17 percent of the time should we expect to see what happened last month.2
This brings us to the “other hand.” While it seems like falling prices is a good thing, on a macro level macroeconomists like those at the Federal Reserve dread deflation. Falling prices on a macro scale, you see, implies a slowing, if not a recessionary economy. Consecutive months of deflation, like occurred in 2020, raise the specter of a depression.
What this means for the Fed
The forecast for real GDP growth in the first quarter of this year is negative. The latest estimate from the GDPNow forecast is -2.4 percent. As Macrosight explained about a month ago, a decline in real GDP implies a decline in inflation. Well, here we are.
Now the Fed has two data points pointing in the same direction, so to speak, to guide its policy decision at its next meeting in May. The direction to which they are pointing is a weakened or weakening economy, suggesting the Fed has every reason to lower its interest rate target.
BUT, not so fast. With recent changes to tariff policy, and the uncertainty and angst surrounding that policy, the Fed may not be so sure.
How so? A likely implication of higher tariffs is higher consumer prices. Exactly how much an increase in tariffs leads to increases in consumer prices is uncertain. The effect will vary across types of goods, industries and so on. And, for tariffs to matter at the macro scale, they have to matter for most goods and industries.3
As such, the Fed is caught between a rock and a hard place, as the over-used expression goes. Inflation appears to be well on its way to getting back to the Fed’s 2 percent target (the year-over-year change for March was 2.4 percent, down from 2.8 percent the previous month). Yet, a few months from now, tariff-related concerns imply the CPI could very well increase.
My best guess is that as of now, the Fed has its finger hovering over the rate-cut button, with the potential implications of tariff policy giving them pause.4 But, a lot can happen between now and the Fed’s next meeting on May 7th.
In their public releases the BLS rounds off, so -0.05 is shown as -0.1 percent.
Since 1952, it has only happened 91 out of 978 months; only 10 percent of the time. The reason that average prices tend to always increase, and rarely decrease is explained here in one of Macrosight’s best posts (in the humble opinion of Macrosight).
By macro scale, I mean enough to matter for most or enough of the 80,000 goods and services that make up the Consumer Price Index.
The current probability of a rate cut at the next meeting is about 30 percent, according to the Federal Futures Market.