According to this source, a record-number of people in the United States played golf in 2023 in some form or fashion (golf course, driving range, Top Golf, etc.). Could this be another form of post-pandemic Yolo-spending? Let’s tee up some data to see!
Par for the Course
Aside from being a challenging, enjoyable, frustrating, and maddening activity, golf provides no shortage of both business-related and behavior-related aspects for economists to ponder (including yours truly). In addition, the U.S. Census Bureau provides data on revenue generated by golf courses and country clubs (through the Services Annual Survey). Figure 1 displays the annual growth rate of total revenue for golf courses and country clubs from 1998 to 2022.
One can clearly see the spike in revenue growth in 2021 and 2022. On the one hand, growth rates of 21 and 10 percent increases in those two respective years are not surprising in light of various other consumer spending-data Macrosight has explored. Yet, those growth rates are dramatically higher than the average growth rate of golf revenue of 2.2 percent from 1999 to 2019. From 2019 to 2022, too, the nominal value of total revenue has increased by about 30 percent (from $21.1 billion to $31.5 billion).
Does this jump in revenue represent a form of YOLO-spending by consumers? Or do these revenue numbers instead capture a jump in what golf venues are charging golf aficionados to tee it up?
Wanted: Loopers
For another perspective on the golfing industry, Figure 2 displays the growth rate of employment from 2010 through 2023 (you can see the series back to 1987 here), a statistic provided by the Bureau of Labor Statistics.
Like the case with revenue, post-pandemic employment growth in the golf industry looks a lot different than before. While the increase in employment has calmed down a bit from the 12 percent growth in 2021, the 5 percent increase in 2023 is still five times the average from 2010 to 2019. From the employment perspective, it appears that golf facilities are faced with the record-setting demand mentioned at the outset of this post (otherwise why the increase in hiring?).1
The possibility remains, of course, that duffers are paying more for golf, just like everything else.
That will be $150 with cart
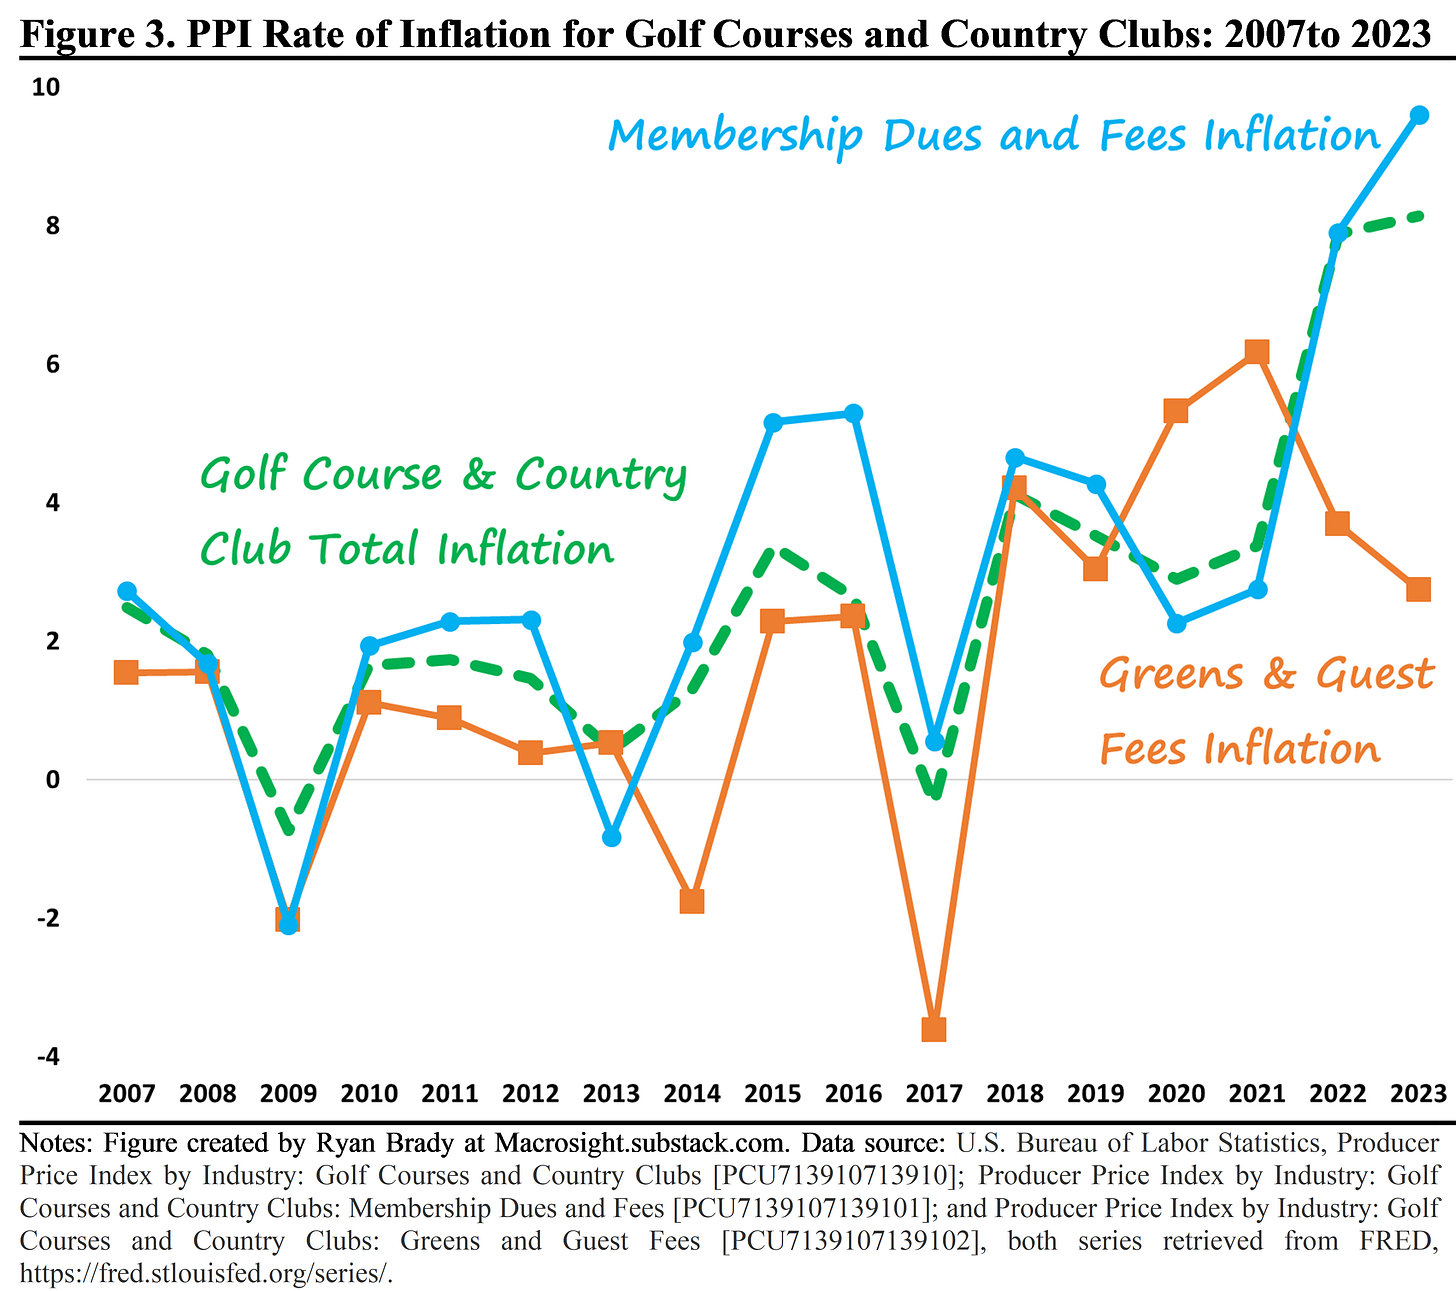
Figure 3 displays three versions of a producer price index (PPI) for the golf industry, each produced by the Bureau of Labor Statistics. Producer price indices show the “average change over time in selling prices received by domestic producers of goods and services. PPIs measure price change from the perspective of the seller”(producer price indexes were detailed by Macrosight here).2
The green, dashed-line represents the rate of inflation calculated from the overall price index for Golf Courses and Country Clubs. The BLS provides sub-indices, two which are displayed on the figure—“Green and Guest Fees” (orange line) and “Membership Due and Fees” (blue line).3
The overall rate of PPI inflation for Golf Courses and Country Clubs, and the rate of inflation for the sub-component, Membership Dues and Fees, have followed a similar pattern since 2007. Since 2020, too, both show high relative rates of increase—with the latter reaching almost 10 percent in 2023, and former series reaching about 8 percent.
The rate of inflation of the other sub-series, Green and Guest Fees, in contrast, has come down the past three years, disinflating from just over 6 percent in 2021 to under 3 percent in 2023.
The 19th Hole
The golf industry does appear to be expanding on the supply-side and, given the various statistics provided by the golf-fact source linked-to earlier, on the demand-side as well. With respect to the latter, while the cost of golf has increased in general (at least as represented by two of the three series shown in Figure 3), more people are getting out to the golf course.
Whether or not this golf “boom” represents YOLO-spending is tough to say, of course. But, both the rise in employment and the jump in revenue post-pandemic are certainly different than before. Indeed, the data shown in Figures 1 and 2 are evocative of the jump in air travel-spending over the same time period (see in Figure 2 of this post), which has been attributed to YOLO-tendencies. So, perhaps a few of the hackers out there knocking it around America’s golf courses are Fore!-YOLO’ing afterall.
Unfortunately, this macro-data enthusiast is not aware of any publicly available consumer spending data on golf expenditure.
From, https://www.bls.gov/ppi/overview.htm, “The Producer Price Index (PPI) is a family of indexes that measures the average change over time in selling prices received by domestic producers of goods and services. PPIs measure price change from the perspective of the seller. This contrasts with other measures, such as the Consumer Price Index (CPI), that measure price change from the purchaser's perspective. Sellers' and purchasers' prices may differ due to government subsidies, sales and excise taxes, and distribution costs.” Note, unfortunately, there is not a consumer price index related to golf.
These PPIs are provided at the monthly frequency, without seasonal adjustment. The growth rates shown in Figure 3 are calculated from the annual value for each index (where the annual value is the average of the 12 months in order to control for the seasonality of the data). Note also that the BLS provides additional Golf-realted sub-indices including “Food and Beverage Sales” and “Equipment Rentals and other golf services.”


