
The Advanced GDP Estimate
It's negative for 2025 Q1

On Wednesday, the Bureau of Economic analysis released its “advance” estimate of GDP for the first quarter of this year. That estimate has real GDP (GDP adjusted for inflation) contracting by about 0.3 percent. That means the amount of stuff our economy produced and/or transacted went from $23.542 trillion at the end of last year to about $23.526 trillion as of March 31 of this year.
As Macrosight has noted, recent data have accumulated that will likely matter for the Fed’s upcoming May 7th policy meeting. The most important data point of all is GDP growth. Just a few weeks ago it appeared the latter might be “going negative” in a big way—with the Atlanta Fed’s Nowcast predicting a whopping -2.8 percent drop.
Yet, as it turns out, we got a much more tepid growth reading. It was negative, yes, but not by much. That is important since any drop in GDP growth is notable, and, size matters. Let’s put the -0.3 estimate in historical perspective, and let’s also learn what the BEA’s “advance” estimate tells us about future estimates.
Negative GDP growth is uncommon, thankfully
Figure 1 displays real GDP growth since the middle of 2009 through the first quarter of this year. Percentages are annualized quarterly changes.
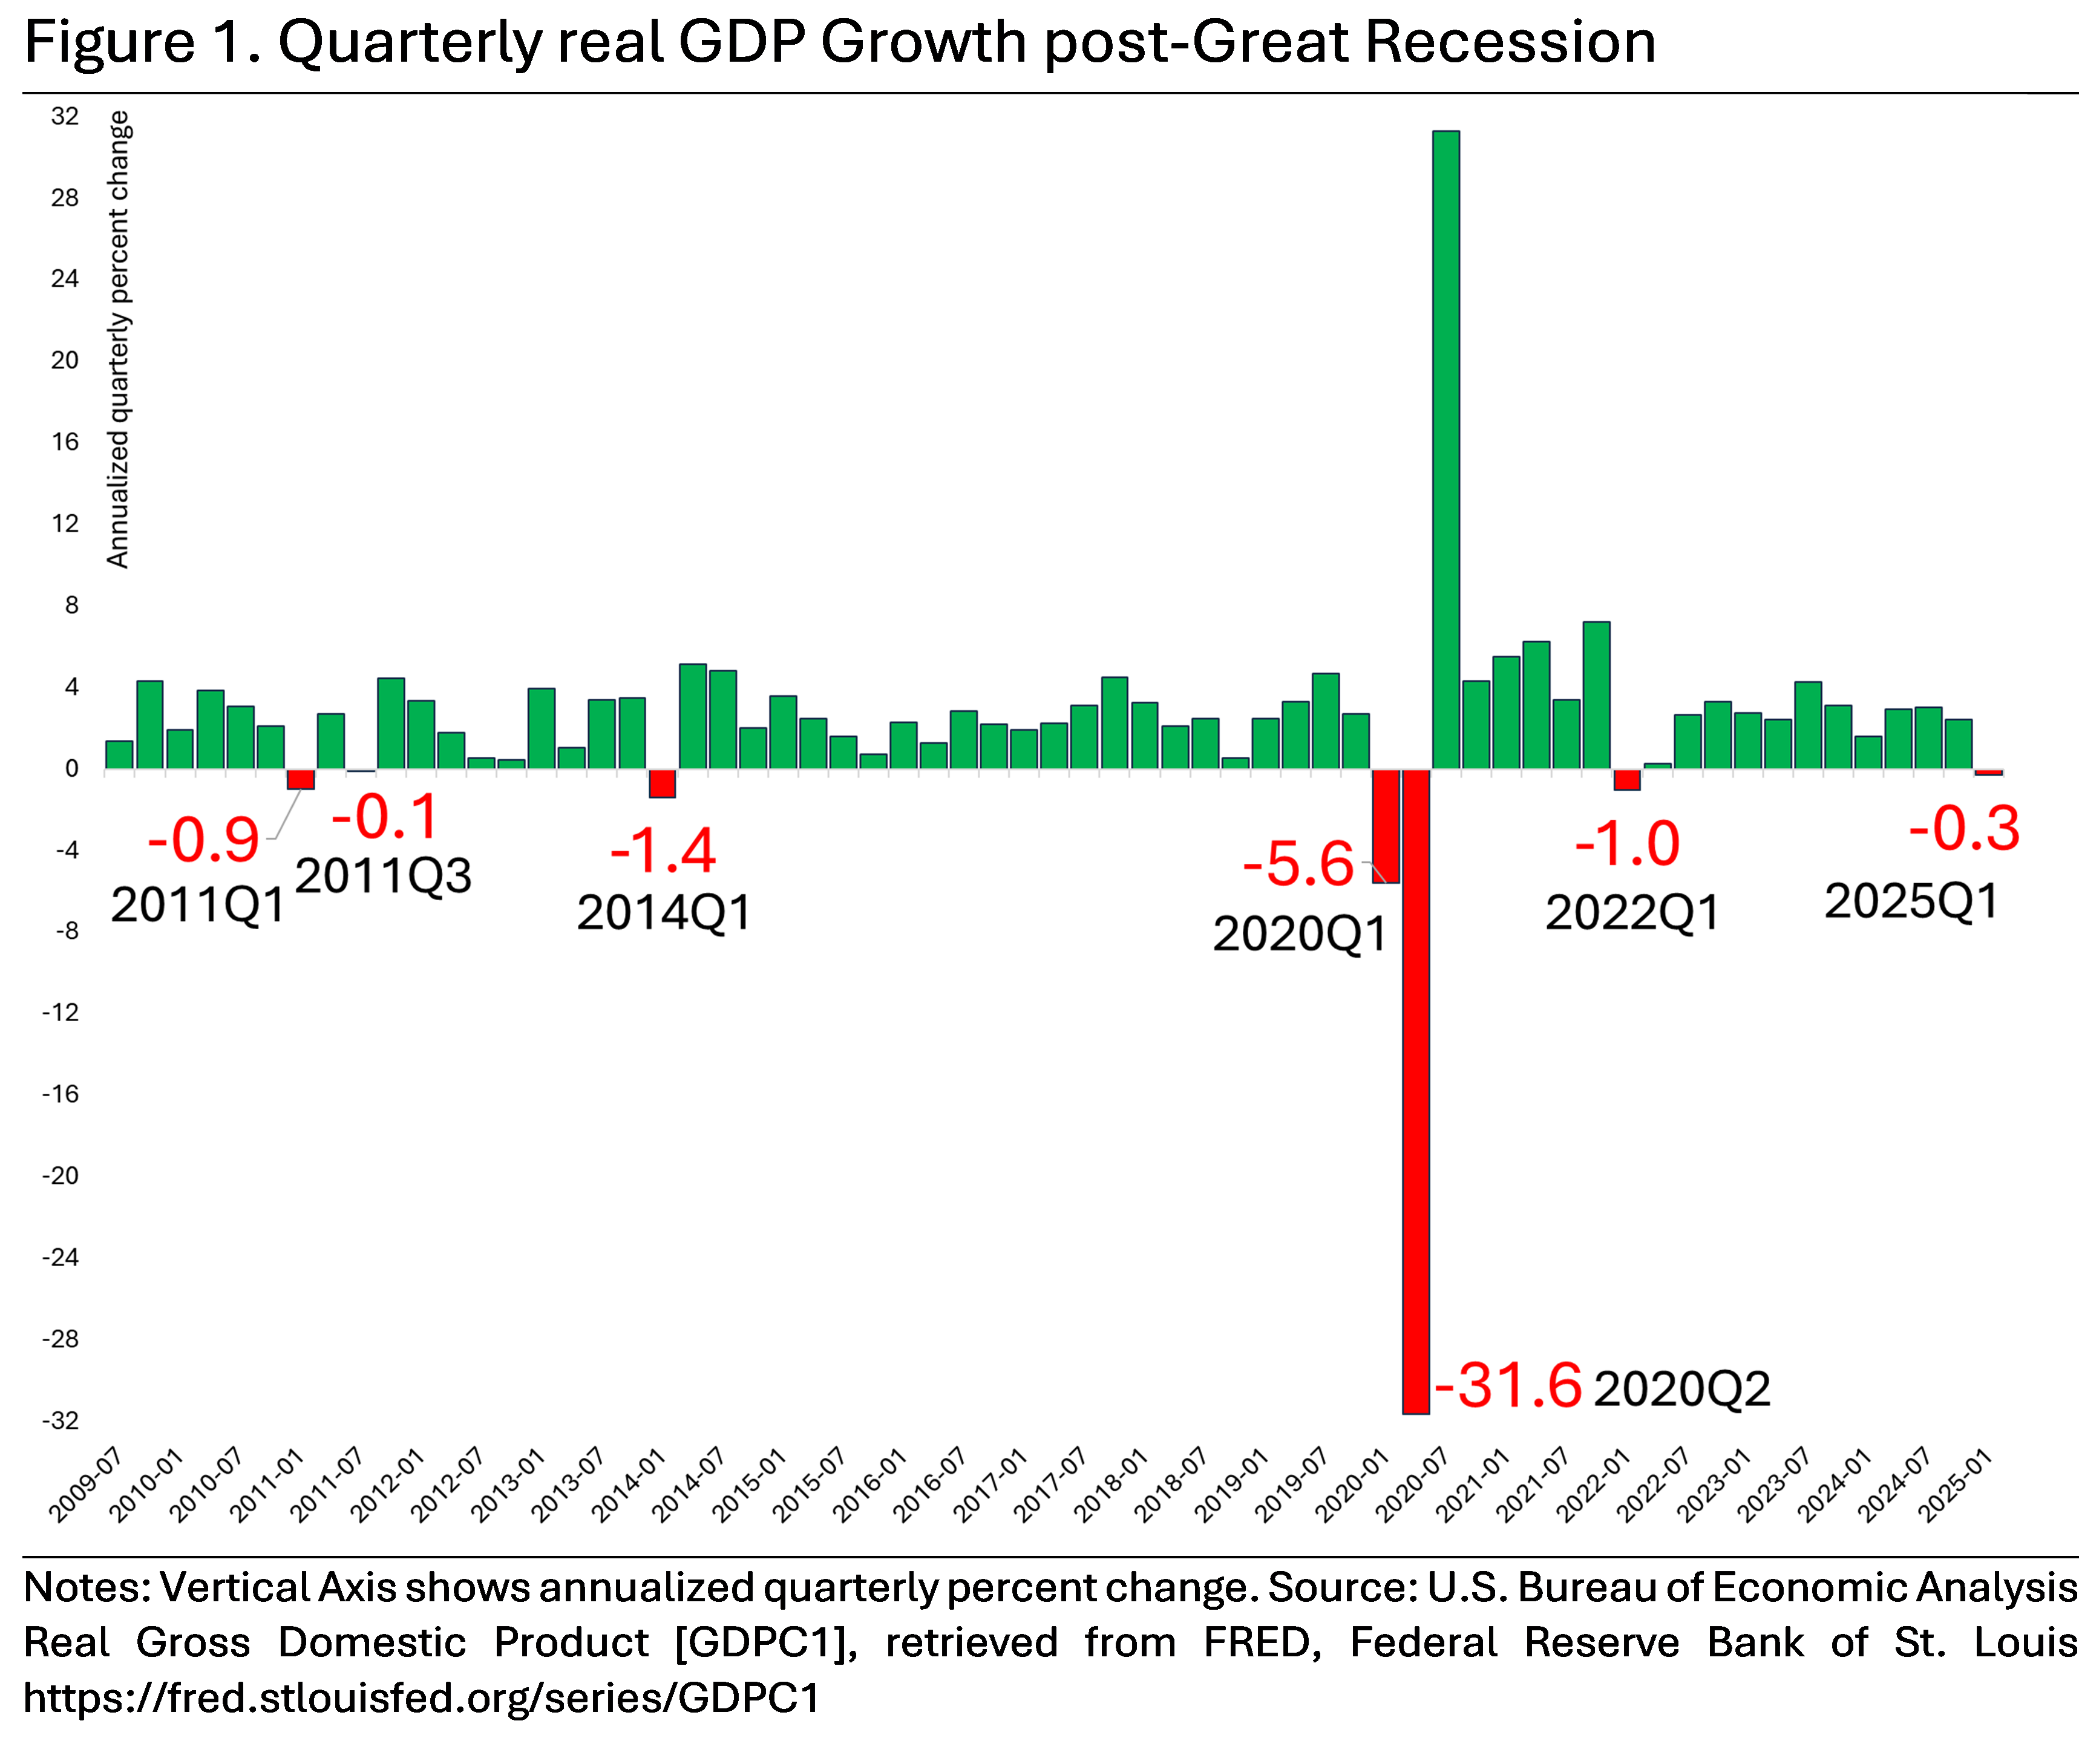
Over the 62 quarters since the middle of 2009—or 15.5 years—real GDP growth has only been negative five times (prior to the first quarter of this year). Aside from the anomalous drops in the first two quarters of 2020, the previous largest decline was -1.4 percent (in 2014Q1). The last negative quarter we had was three years ago (-1 percent in 2022Q1; Macrosight wrote about that negative quarter here).
If we go back further, from 2000 through 2009Q2 (not shown on Figure 1), there were only six quarters where growth was negative. Five of those were were during the Great Recession (five of the seven quarters spanning 2007Q4 to 2009Q2). The other two occurred in 2001, Q1 and Q3.
In the last 25 years, that is, there has been a total of 11 quarters with negative growth. Negative quarters are uncommon historically, too. In only 14.4 percent of all quarters going back to 1947 is real GDP growth negative.
A negative real GDP growth rate is not the norm, thankfully. But, when it happens, it is certainly something to which we should pay attention. Fortunately, the BEA’s advance estimate for last quarter is relatively mild. If this estimate holds up, it would represent the smallest quarterly contraction since 2011.
By “holds up,” I mean the value -0.3 percent is just the first estimate of 2025Q1 growth the BEA will release. A month from now we’ll get a second estimate and then a month after that (the end of June), we’ll get the “third” estimate. The third estimate will stand until any updates are made at the end of the year. Let’s dive into what all that means.
GDP Data Gathering and Revisions
Measuring the macroeconomy is a massive undertaking, a task which the BEA is charged with. To do so they rely on a number of sources, all of which are explained in detail in Chapter 3 of the GDP bible, a.k.a, the “NIPA Handbook: Concepts and Methods of the U.S. National Income and Product Accounts.”
Since it takes a while for the various sources to report or send their data to the BEA, the BEA follows the aforementioned release schedule of a “advanced,” “second,” and “third” estimates.1 Then, the BEA will crosscheck all initial data at the end of the year, in addition to comprehensive reviews every five years (all of this is explained in Chapter 3 of the GDP bible).
This begs the question: how close will the second and third estimates be to the current advanced estimate of -0.3 percent? Well, thanks to the folks at the St. Louis Federal Reserve Bank, we can try to answer that. The St. Louis Fed provides a data portal where one can obtain “vintage” versions of all the macroeconomic data the BEA puts out (or most of it anyway). This portal is called “ALFRED,” and through ALFRED Macrosight took a look to see what we can expect.
Specifically, Macrosight took a look at recent advanced, second and third estimates for the last two quarters of 2024, displayed in Table 1.2
In the third quarter of last year, the three estimates were pretty close; as such, so too were the implied growth rates. As of now, the third estimates you see in the table are the current official estimates for those quarters. So, from advanced all the way to third, there were not huge changes. The differences in the estimates are large in terms of dollars—billions—but, considering the BEA is measuring trillions worth of economic activity, these numbers are relatively close.
In both quarters, the estimates increased. In eye-balling the vintage data over time (in the Excel spreadsheet downloaded from ALRED) that is not always the case. However, even when revised downward, the three estimates are typically relatively close, like we see in Table 1.
Again, the estimates change due to the time-lags associated with gathering the source data. As noted by the BEA, “revisions do not reflect errors. On the contrary, revisions are mainly driven by the incorporation of more complete and revised source data, and the release of the revised estimates is determined by the availability of these data”(NIPA Handbook, chapter 3, page 3).
With this discussion in mind, I suspect that the second and third estimates for 2025 Q1 will not be that far off from -0.3 percent. But, as mentioned earlier, too, size matters. Given the revisions could swing by a few billion dollars as shown in Table 1—A fall of only 0.3 percent is small enough that by the second revision the Q1 growth rate could easily swing positive.3
Here is how the BEA describes the gist of these three estimates (on page 8 of Chapter 3): “The advance quarterly estimate of GDP is released near the end of the month that follows the close of the reference quarter. For most of the product-side components, the estimate is based on source data for either 2 or 3 months of the quarter. In most cases, however, the source data for the second and third months of the quarter are subject to revision by the issuing agencies. Where source data are not available, the estimate is based primarily on BEA projections.
One month later, the advance estimate is replaced by the second estimate, which is typically based on source data for all 3 months of the quarter. However, in some instances, the source data used for the second estimate, particularly the data for the third month of the quarter, are subject to further revision.
One month later, the second estimate is replaced by the third estimate, which incorporates revisions to source data for the third month of the quarter and newly available quarterly source data for some components.”
The specific access point to download GDP vintages is here. It is a little confusing to figure out how to read the Excel file that provides all the vintages. Moreover, it is challenging to track the revisions and updates to the data over time. For that reason, Table 1 only includes the most recent two quarters of GDP data. Macrosight had initially intended to construct a historical average of how estimates change (from advanced to second to third). But, it quickly became apparent such historical analysis would take a long time, more time than Macrosight had for this post. It is a rabbit-hole Macrosight may yet go down, just not today.
Or get more negative, of course. Back in 2022, the advanced, second and third revisions for 2022 Q1 read -0.4, -1.64, and -1.63 percent, respectively. So, the estimate can definitely get worse! On the other hand, in that same year, the advanced, second and third revisions for the second quarter read -0.14, -0.58, and -0.58 percent, respectively. Yet, after a comprehensive revision to the GDP data a couple years later, the growth rate for 2022Q2 was bumped up to +0.28, which is the current official estimate for that quarter. Notice, too, on Figure 1 the current official estimate for 2022 Q1 is -1.0 percent, less than the -1.63 third estimate made in 2022.