Now that the Fed has once again cut its target interest rate (the Federal Funds rate), this time by 25 basis points, let’s look ahead to what effect this might have on the housing market. To do that, let’s look at what has happened in the housing market recently. With that perspective, we can then speculate on what is coming in 2025.
Stop it, mortgage rate
In the two weeks since Macrosight discussed the stubborn 30-year fixed mortgage rate, said rate continues its insolence. As of yesterday, the 30-year fixed mortgage rate equaled 6.8 percent (about three-tenths higher than two weeks ago).
Considering that the Fed has now lowered its target interest rate twice in less than two months (by 75 basis points total), what should we expect to happen to the mortgage rate?
Figure 1 displays the mortgage rate alongside the federal funds rate (both at the monthly frequency) going back to 2015.
These two interest rates track each other relatively closely over time (this is true, too, if you look back farther in history—this connection was discussed in September by Macrosight). While there are a variety of market forces pushing the mortgage rate this way and that, it appears that as the federal funds rate increases and decreases the mortgage rate follows. It may not follow the federal funds rate in “lock-step,” but over time there certainly appears to be a link between the two.1
Given the history between the two variables, I think it is a reasonable forecast to expect the 30-year mortgage rate to decline over the next few months (unless inflation reverses its recent disinflationary course—but more on that later).
If the mortgage rate does decline in the coming months what will that mean for the housing market? Let’s look at a few variables to see.
Housing Sales & Prices
Figure 2 displays the year-over-year percentage change of home sales for each month from 2015 through September of this year.
For the five-year period prior to Covid-19, home sales averaged 10 percent growth per month (measured year-over-year). You can see what happened after. The good news is that since 2023, the growth in sales has been positive, about 9 percent since 2023, and 3.4 percent in the first nine months of this year. If mortgage rates drop, I expect we would see even stronger growth in this variable in 2025.
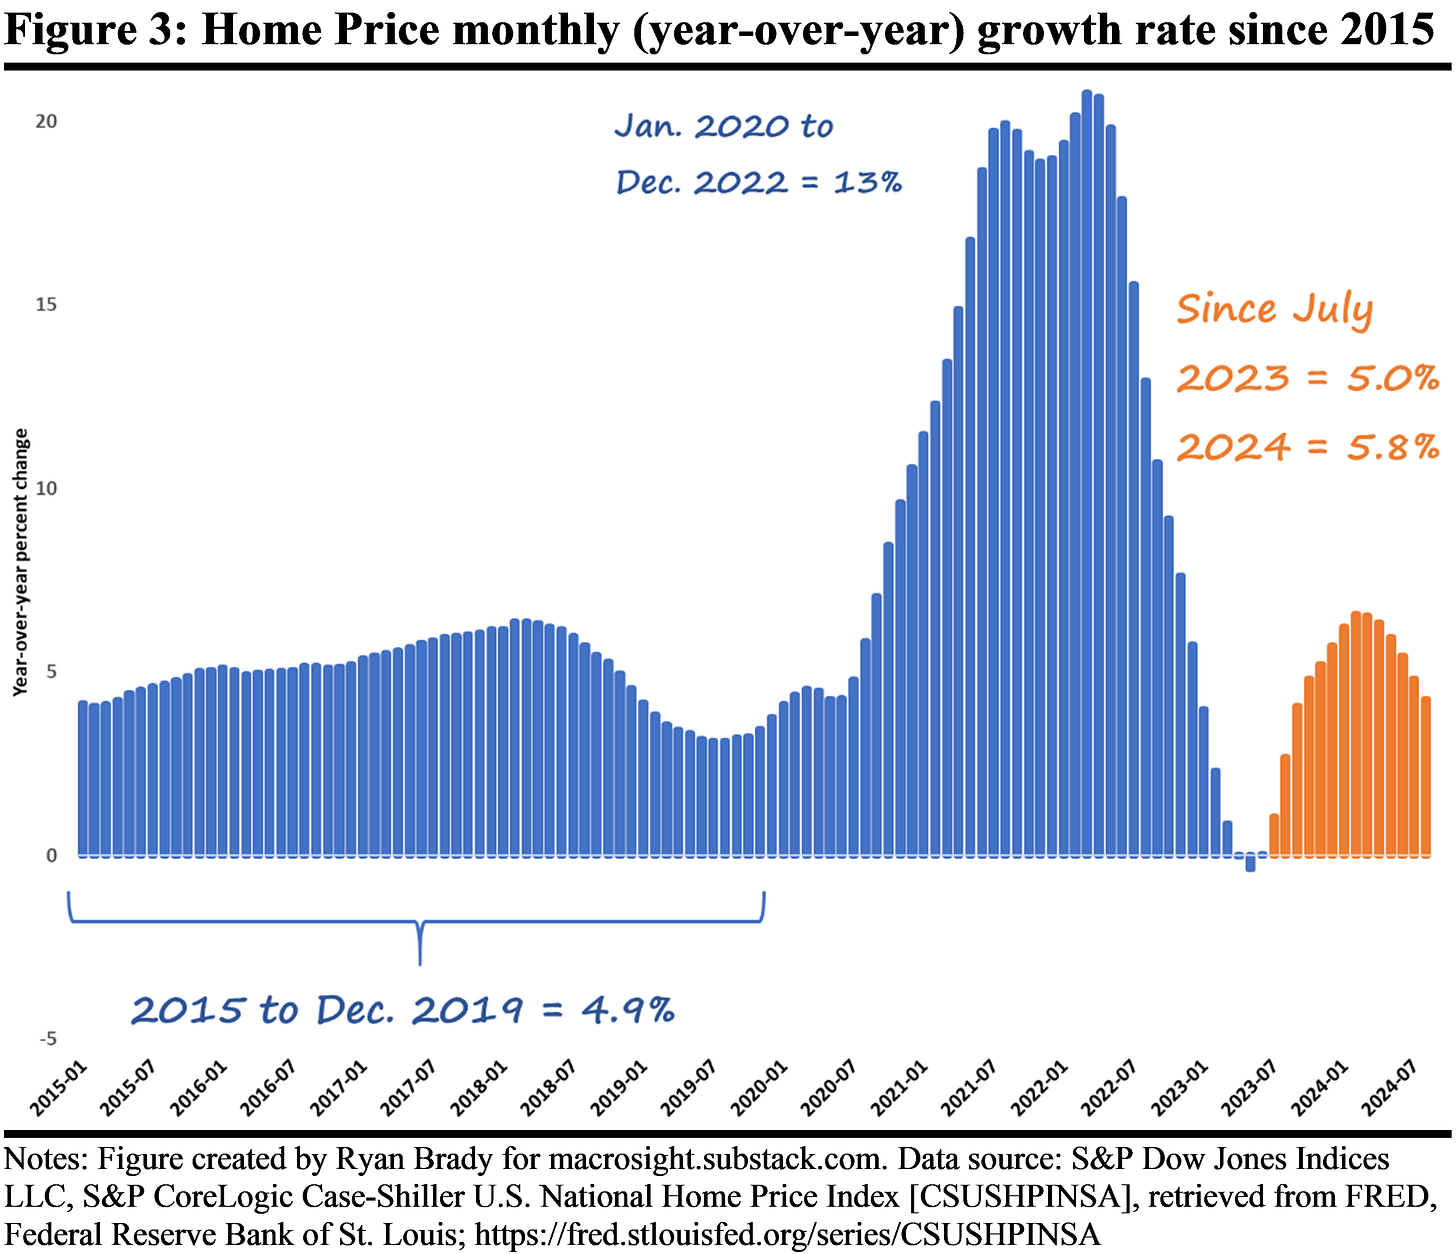
Figure 3 shows average home prices over the same period.
Similar to the case with sales, it appears that in 2023 and 2024 home prices are in line with the pre-2020 period, in not a big higher. Of course, rising prices is not great for all buyers, but in the least, this variable reflects a “return to normal.” As the mortgage rate falls, expect housing prices to continue to increase.2
The Demand-Side
Aside from the housing-specific variables, what should we expect from households? Figure 4 displays real disposable income since 2015 (“real” meaning the variable is adjusted for inflation).
This variable provides a positive signal for not only the housing market but for the economy overall. Since 2023 real disposable income has increase by 4.3 percent on average. That increase has slowed a little in 2024, but the average for 2024 is on par with the pre-Covid-19 era (2015 to 2019).
Keep in mind this statistic represents the purchasing power of our wages and sales (that is what it means to be inflation-adjusted). That is why we can see the notable decline of real disposable income from April 2021 to December 2022. That period coincides with the Beastflation we experienced over that general time frame.
Since 2023, as inflation has subsided, our real incomes have increased. Since the rate of inflation is still, in fact, positive,3 that implies increases in nominal disposable income have outpaced the rate of inflation.4
Increasing real incomes bodes well for future home sales.
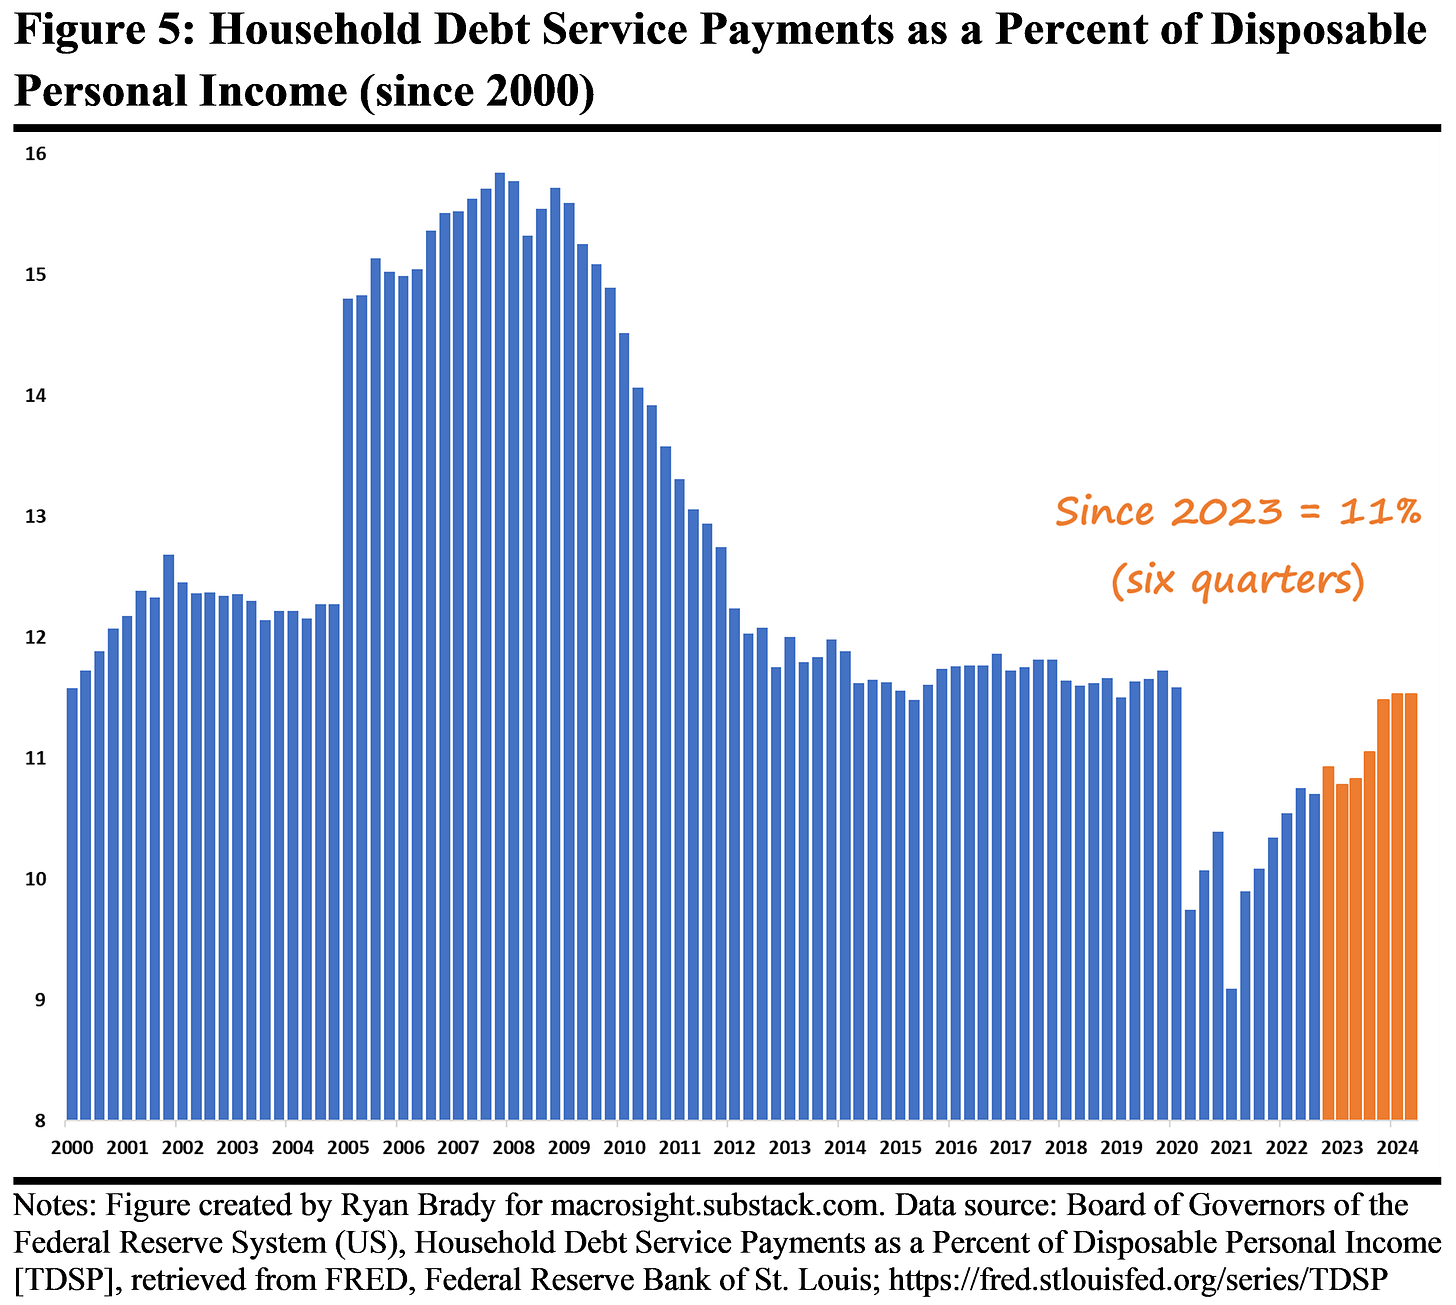
On the other hand, the higher interest rates of the past couple of years implies that households are paying more for whatever money they are borrowing. In that sense, a decline in the mortgage rate is needed to relieve that burden. Yet, as can be seen in Figure 5, the debt-burden of households is still relatively low compared to history.
Figure 5 shows this debt-burden since 2000 (Macrosight previously discussed this variable in this post).
While the debt-burden has increased since the nadir in 2021, the values for 2023 and the first two quarters of 2024 are comparable what was the case in the few years prior to Covid-19, and nowhere near the heights during the 2005 to 2010 period. If mortgage rates do decline, as this blog expects, then this measure should decline, too.5
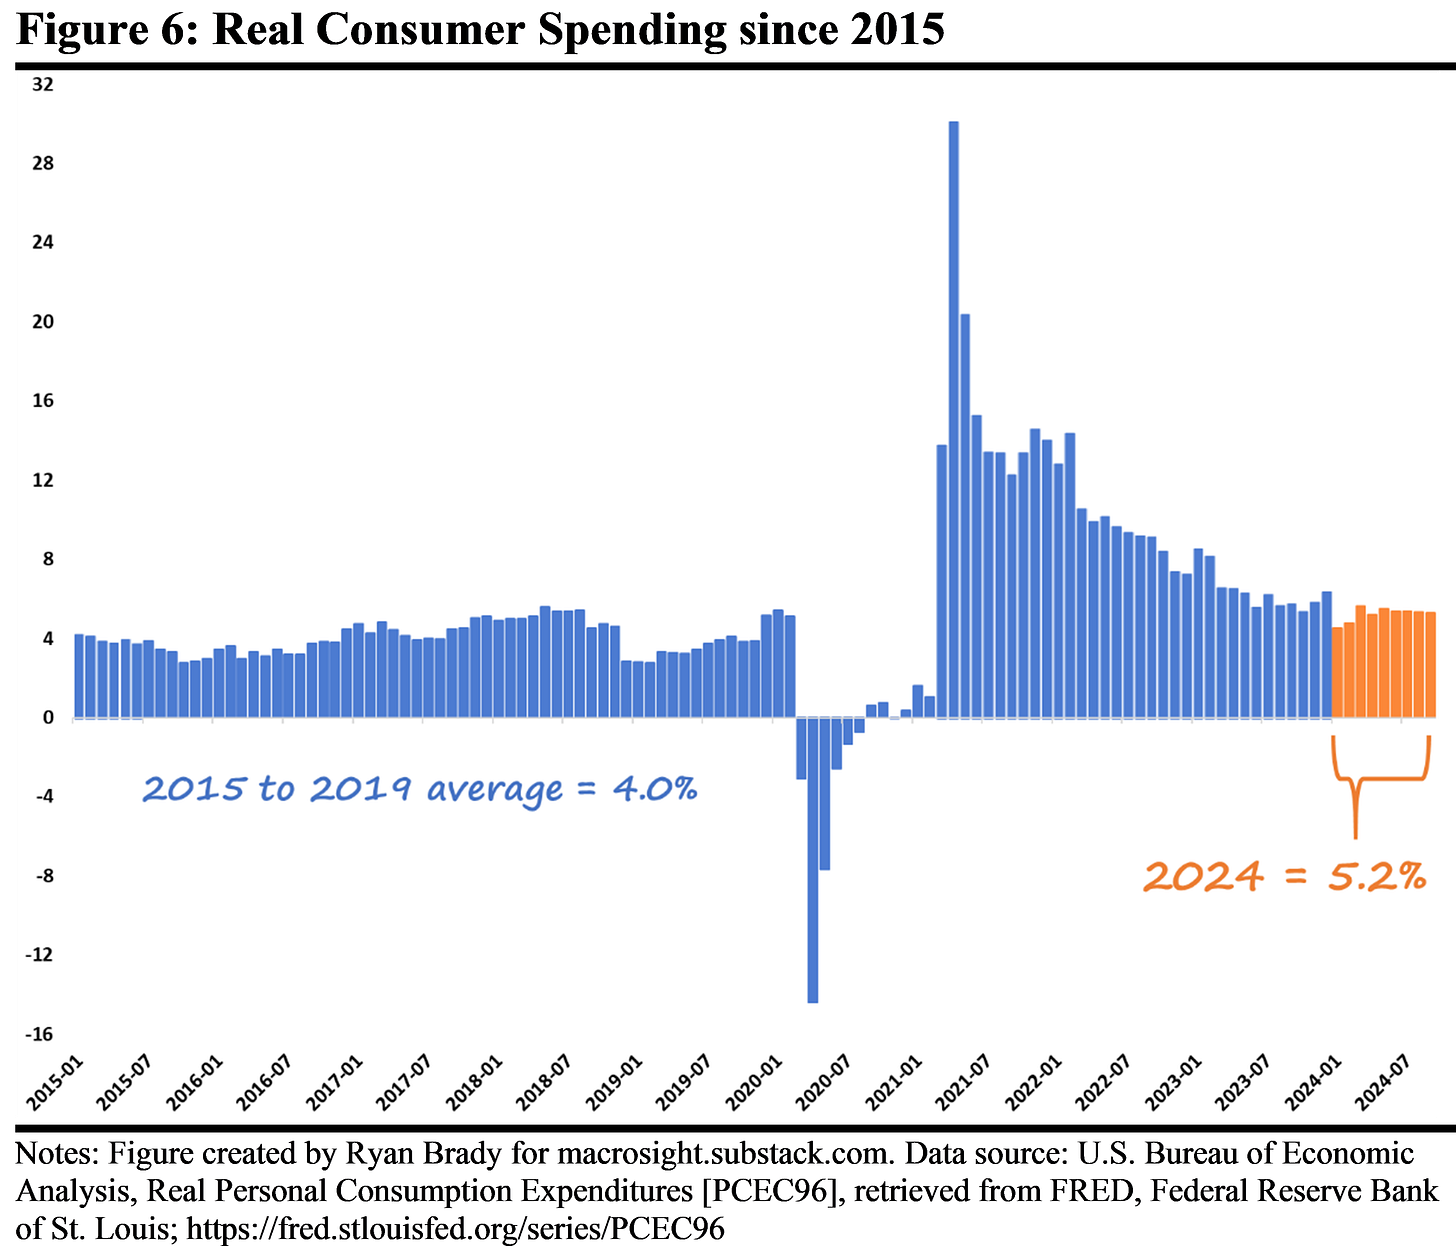
Finally, Figure 6 displays real consumer spending (inflation-adjusted) since 2015.
This figure, too, provides some optimism with respect to not only the housing market but the economy overall. Consumer spending has been stable-to-strong since late 2020—a fact chronicled many times by this blog (see here for an example). And while the average rate has slowed compared to the immediate post-Covid-19 era, the 5.2 percent average in 2024 annotated on the graph is still higher than the average from the few years prior to Covid-19.
Overall, these three “demand-side” variables—income, debt-burden, and consumer spending—suggest that U.S. households (at least from the aggregate view) are on solid footing.
A Forecast
As of their September meeting, the Fed anticipates lowering the Federal funds rate to 4.4 by the end of this year (September is the last published forecast from the Fed). By the end of 2025, 3.4 percent. Those projections are based on the assumption that the rate of inflation continues to converge to 2 percent and remains around two percent for the coming year.
Assuming that transpires, and based on the history of the connection between the federal funds rate and the mortgage rate, we should expect the mortgage rate to decline over the course of 2025 (and perhaps do so here very shortly over the remaining weeks of 2024). If so, given the already-solid state of the housing market suggested by the data highlighted in this post, it is reasonable to expect a stronger housing market in 2025.
I am simplifying the explanation by saying that the mortgage rate “follows” the federal funds rate. In truth, it is likely each variable is connected by a common factor. For example, in early-2021 the mortgage rate started to increase a few weeks before the Fed raised the federal funds rate from zero to 0.25 (that occurred in March 2021). Both the Fed and mortgage markets were reacting to the increasing inflation at that time, which was the common factor. However, if we assume that a rise in the federal funds rate helps bring down the rate of inflation (the intent of the policy), and the 30-year mortgage rate follows suit, then the simplified narrative of the mortgage rate following the fed funds rate suffices.
As noted in this post, mortgage applications have increased, suggesting an increase in the demand for housing. That helps explain the positive growth in housing prices the past couple of years. And while inventory has increased a bit in 2024, inventory levels are still much lower relative to a few years ago. Hence, there is little reason to expect housing prices to decline anytime soon.
By “nominal” I mean the numbers you see printed on your paystub, or direct-deposited into your bank account. That number represents our nominal earnings. Accounting for the purchasing power of those earnings represents our “real” income. Macrosight explained the difference between real and nominal GDP here, and real versus nominal disposable income here.
As noted by an astute reader of Macrosight’s post on mortgage rates a few weeks back, there are concerns that credit card debt is catching up with consumers (see this article, for an example). While that is certainly a development to watch, it is still the case that the debt-burden related specifically to consumer loans and credit cards is below the levels from 2015 to 2019—that data can be seen here.


