Much to Macrosight’s chagrin, “consumer confidence,” or “sentiment,” is once again in the news. Surveys capturing said sentiment reveal that, well, it’s low. But for those that have read this blog before, you know how Macrosight feels about the attention paid to this particular weather vane.
But, in the least, with GDP prognostications causing alarm, and the Fed currently unsure of things, it is a good time to check in on consumer spending. While Macrosight did so recently, in this post we’ll focus on consumer durables.
Durables
Consumer durables are one of the three sub-categories of consumer spending. The category includes “tangible” items that can be stored and inventoried, in addition to other things like software products. Examples include cars, furniture, appliances and other equipment most persons will hang onto for a while, defined as anything a household will keep for three years or more.1
Durables, while comprising the smallest share of consumer spending, may provide a window into consumers’ psyches—or dare I say, sentiment—in so far as these big-ticket items may be the first things worried consumers cut back on. Also, many of the goods included in this category, such as autos and furniture, may be particularly sensitive to changes in interest rates.
Let’s look at some data.
Spending on Durables over time
Figure 1 displays the month-to-month percent change of spending on durable goods since January of 2023 (percentages shown are annualized).
The highlight of the figure is the most recent observation for January. Durables dropped by about 40 percent on an annualized basis. While it is not unusual to have such a big change in durables—we can see large numbers in various months the past two years—the decline of 40 percent does represent the biggest drop in a while (the last decline greater than 30 percent was May 2022).
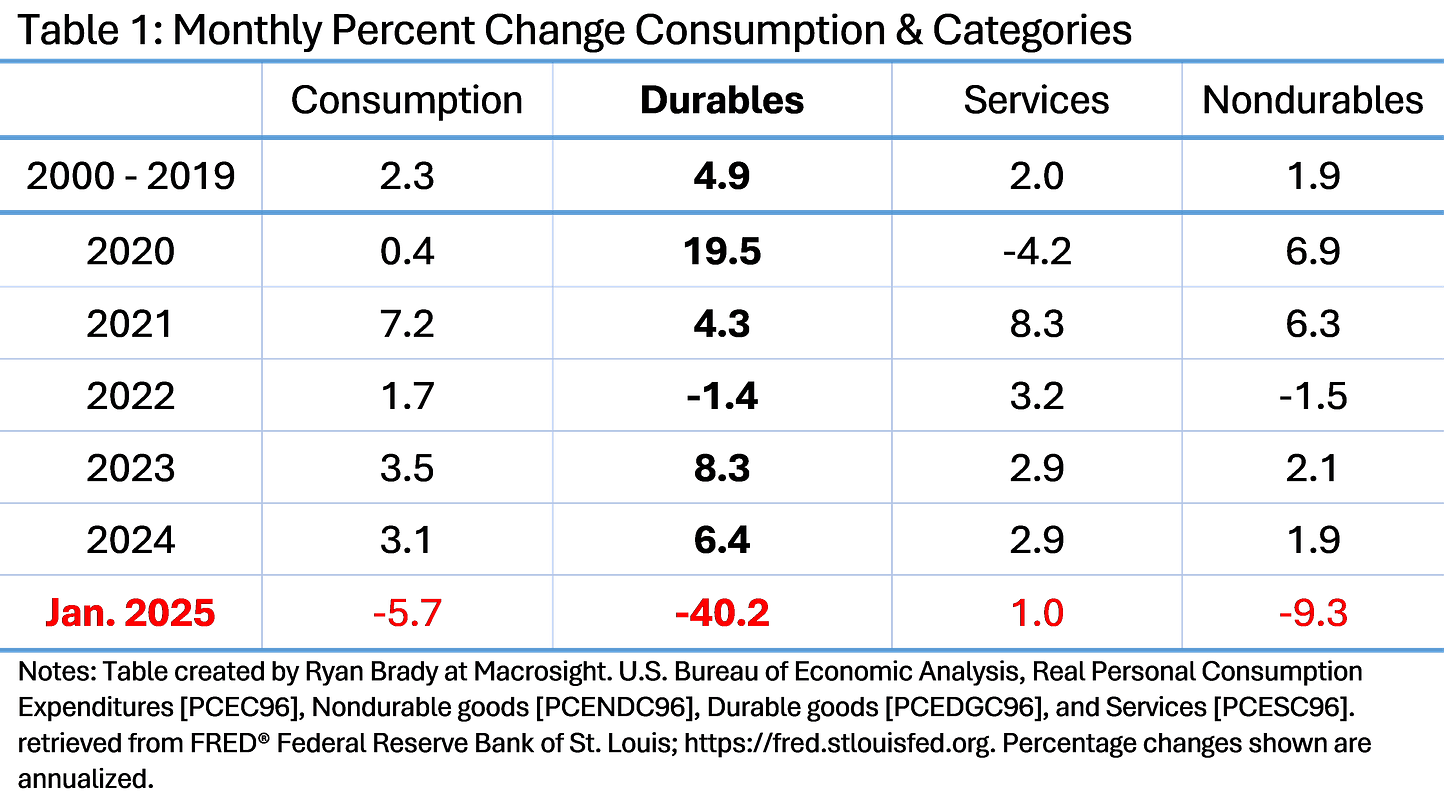
Table 1 provides some additional perspective.
Spending on durables the past two years has averaged about 7 percent the past two years, which is above its pre-2020 average of 4.9 percent. Total consumer spending has also been strong the past two years, driven by the durables category and also services (which made up about 64 percent of the total in 2024, compared to 13 percent for durables)).
What might the data reveal about the rest of 2025?. Let’s consider a pessimistic case and an optimistic case.
Pessimistic
Consumer spending, and durables especially, is due for a cooling-off period. We had one in 2022, which may have been a hangover from the roaring year that was 2021 (along with the second half of 2020).
The decline in non-durables of 9.1 percent shown in the last column of Table 1, coupled with the decline in durables, is an especially bad omen. The fall in non-durables means that not it was not just the big-ticket items, but regular stuff, too, that consumers cut back on. Even spending on services was unusually low in January.
If these trends continue in February and March, then surely real GDP will be in the negative (consumption, recall, makes up about two-thirds of GDP).
Optimistic
The durable goods category is the most volatile. As already mentioned, it is not unusual to see big month-to-month drops (or increases). The standard deviation of durables equal about 36 percent (calculated from January 2000 through January 2025).
That implies about 68 percent of the time we would expect a change in durables to range from -36 percent to + 36 percent. So, maybe 40 percent is not that alarming? (Also, the 9 percent drop in nondurables is well within its standard deviation of 14 percent.)
While the Fed did not lower its interest rate target this week, if GDP does end up in negative territory this quarter, and inflation continues to abate (like it did in February, at least), then we may see a rate cut before the summer.2 If so, that could give durables a jolt over the second half of the year.
Or maybe not
That latter point assumes that interest rates actually matter for consumer spending. It is not clear that is the case, at least at the macro level (a point made previously by Macrosight). Afterall, spending on consumer durables averaged 8.3 percent per month in 2023 and 6.4 percent in 2024. As shown in the table above, both numbers were well above the category’s historical average—in spite of the fact that the federal funds rate increased from zero percent in March 2022 to 5.5 percent in the summer of 2023, and then stayed there until the summer of 2024.
In other words, who the h@ll knows.3
The current probability of a 25-basis point cut at the May 7th meeting is about 14 percent.
The macroeconomy is so difficult to predict and/or make sense of, I feel compelled to offer an olive branch to those that make so much of consumer sentiment. At least they are trying to make sense of things. And it’s not as if Macrosight has all (or any of) the answers either—as this rambling post can attest.


