Macrosight, it seems, has been distracted by summer fun and frivolity. So much so that last week, said macroeconomic enthusiast over-looked the fact that the Federal Reserve’s policy committee had convened for its June meeting. Such an oversight is an embarrassing gaffe for any self-respecting macroeconomist.
Mea Culpa.
So, what happened? Well, as they had for the previous six meetings, the Fed stood pat. Their target interest rate remains at 5.25-5.5 percent. In their published statement the policy committee cited that “economic activity has continued to expand at a solid pace . . . the unemployment rate has remained low [but] Inflation . . . remains elevated.” etc., etc., and so on. Hence, as has been the case for almost a year, the Fed’s target interest rate remains unchanged.
That “ho-hum” outcome, however, is not the end of it. If you take a closer look at last week’s meeting, something did change. So, let’s take a closer look.
A turn for the worse?
June is one of the four months the Fed releases their economic forecasts (in addition to September, December and March). This month’s forecast contained the change: by the end of 2024 the Fed now expects to lower their target interest rate to 5.1 percent, instead of the previous expected 4.6 percent.1 Figure 1 displays a snapshot of the Fed’s June projections, with their “projected policy path” circled in red.
This change in the expected year-end level for the federal funds rate is not great news if you are hoping to refinance your house or take advantage of declining interest rates in some other way.
But, as the Fed noted in the policy statement mentioned earlier, the reason for their change in plans is good news. The macroeconomy has been doing well, is doing well, and is expected to keep doing well. Let’s take a closer look at that, too.
Patient stabilized
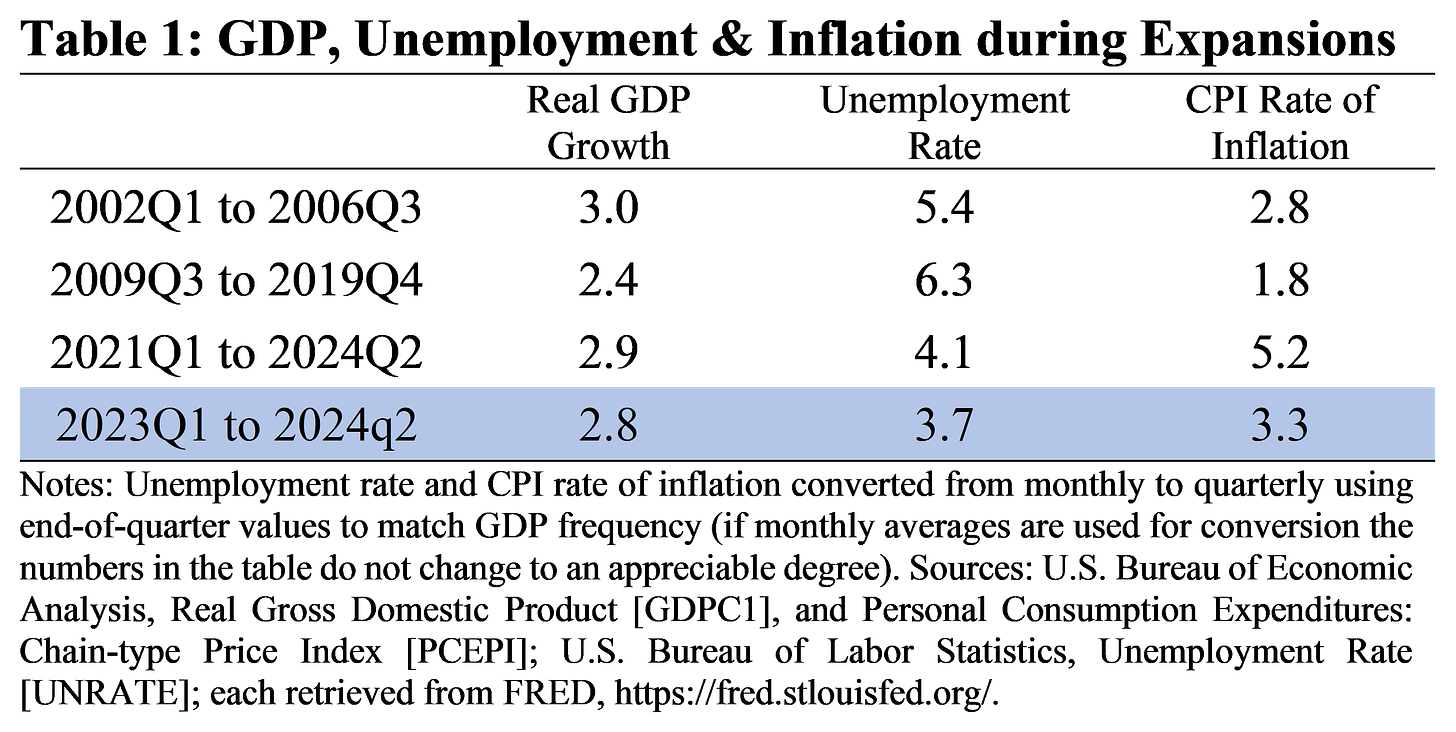
As has been well-covered on this blog, the U.S. macroeconomy has been pretty darn stable, if not robust, and pretty resilient the past couple of years. To understand this point, Table 1 compares our recent experience to the last two expansions—the first quarter of 2002 through the third quarter of 2006, and the third quarter of 2009 through the end of 2019 (as dated by the NBER). Table 1 highlights the “big three” macroeconomic statistics: real GDP growth, the unemployment rate, and the CPI rate of inflation.2
The first two rows of Table 1 show the data for the two previous expansions. The third row displays the data since the beginning of 2021, and the last row, since the beginning of 2023. Let’s focus on the latter.
With respect to real GDP growth we have been in line with the previous two expansions. In 2023 real GDP growth averaged about 3.1 percent and assuming the GDPNow’s forecast for the second quarter (also 3.1 percent—as of June 18), over the first half of this year we have averaged about 2.2 percent growth. The latter is a bit lower than the last expansion, but we are not too far off that pace.
The average unemployment rate over the past six quarters, averaging 3.7 percent—is below the averages of the earlier expansions. Indeed, the rate has been below the “natural rate of unemployment” since October 2021.
The CPI rate of inflation has been much more “well-behaved” the past six quarters than the couple of years before that.3 By historical standards, 3.3 percent is above the previous expansions, but we are not that far off the average rate in the early-2000s expansion. The May reading for the CPI rate of inflation, too, is encouraging. Reported last week by the BLS, the CPI rate of inflation was zero percent.4
A positive prognosis
Many may not get that excited about the data displayed in Table 1, especially 2.8 percent real GDP growth. During the 1990s expansion, for example, real GDP growth averaged 3.8 percent.5 So, unfortunately, we are not running 1990s-hot.
Yet, we are at least ahead of the 2010-2019 pace. And, 2.8 percent is above the Fed’s expectation for the next couple years and beyond. If you look again at Figure 1 you can see their forecast for growth the next couple of years is 2.0 percent. Beyond 2026, the Fed’s “long run” forecast is growth equal to 1.8 percent (which has been the case well-before Covid-19).
Putting our recent economic performance in historical context in this way is key to understanding the Fed’s cautious “wait-and-see” approach. By the Fed’s standard, the rate of inflation should be about 2 percent and that rate should align with a rate of real GDP growth around 2 percent, if not 1.8 percent. Hence, by that standard, at 2.8 percent growth we are running relatively hot. Similarly, by historical standards, a 3.8 percent unemployment rate is pretty good, too. And, believe it or not, a 3.3 percent rate of inflation is not that bad either. As such, the Fed waits, and so do we.
The second quarter of this year has not yet concluded. Hence, for real GDP growth in the 2nd quarter of this year, I used the current (as of June 18th) GDPNow estimate from this source; for the unemployment and CPI inflation rate I used the average of April and May’s values. Note also I used the CPI instead of the PCEPI, the Fed’s preferred inflation measure, since the CPI had the more recent May-observation. The PCEPI for May does not come out until the end of June.
While it has not felt like inflation has been well-behaved, the metric has been disinflating since June 2022.
Like last week’s Fed meeting, Macrosight shamefully also forgot the BLS released its May CPI report on Wednesday of last week, which contained that bit of good news.
The 1990’s expansion lasted from the second quarter of 1991 through the fourth quarter of 1999.


